
-
Full documentation and detailed video-review of MyStat.
Full and detailed video-review of MyStat.
This video review contains full and detailed information on the product’s features. Additionally, all the necessary information on the product is mentioned again as an illustrated text further on this page. -
Do you need help?
Product Documentation.
Product Description.
 MyStat is a unique product in the area of statistics, analytics and SEO optimization. MyStat is a comprehensive set of tools necessary for collecting and classifying data from all areas. The product is a multi-platform one, so it can be installed onto both existing popular types of CMS and onto any other third-party developed sites. If you have your own web-site, you should definitely have it in your arsenal for running a successful business, blog or any other Internet project. The previous version of myStat has over 500,000 downloads and strictly positive reviews! MyStat can help you with correct organization of working on any resource, help SEO optimizers, programmers, bloggers, designers, advertising agents, and later updates of this product will further expand the area of its application. Each licensed product copy owner will be able to receive all updates and get full technical support totally free of charge. MyStat has unique capabilities for statistics and analytics. MyStat is completely safe, it guarantees full confidentiality of your data, and it is fully configurable to suit specific purposes. Based on all the supplied information one can develop a realistic and detailed strategy for site, business, or any other project development.
How can the product be obtained?
The product is available in two versions – the free and the paid ones. The free version can be downloaded from the official WordPress repository. This product has limited functionality. The paid version provides the full product functionality with full technical support, as well as further free future product updates.
Product Purchasing.
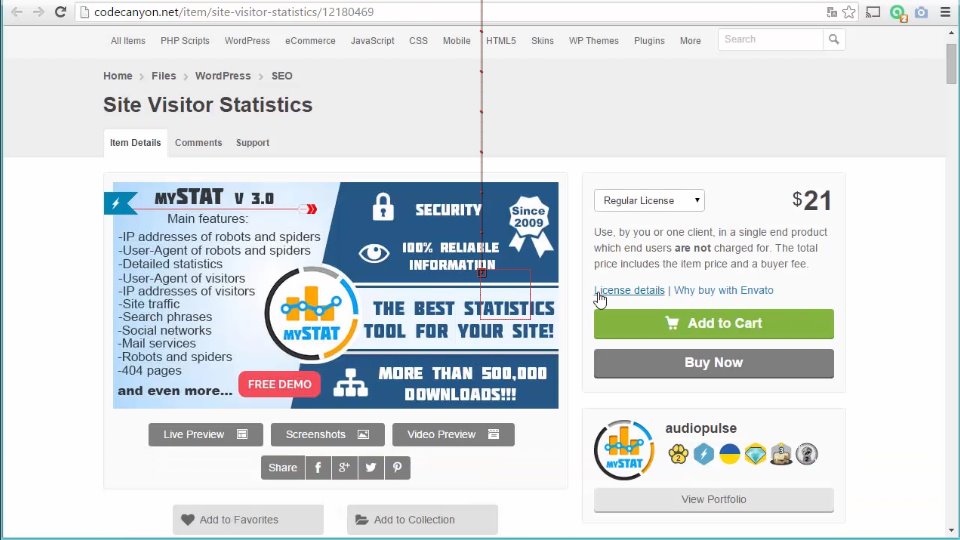
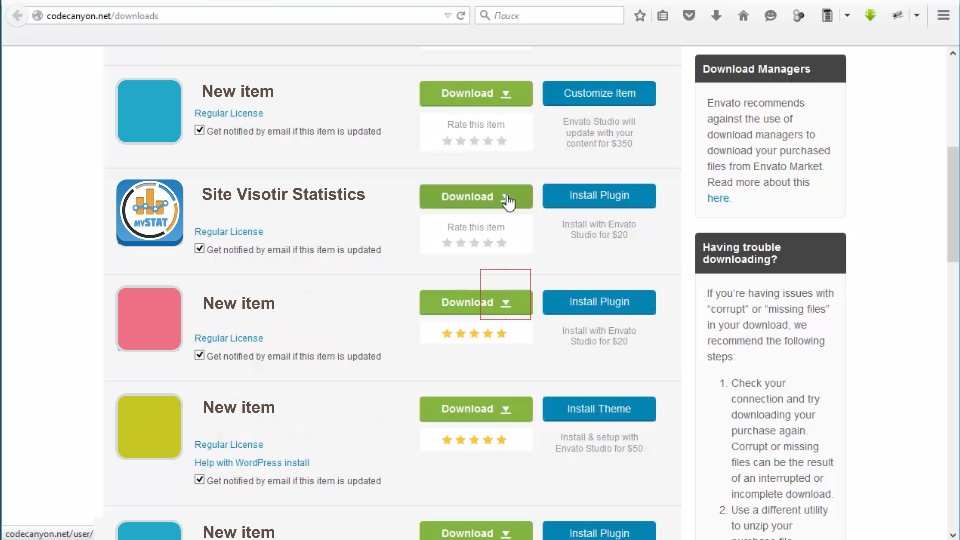
The paid version provides the full product functionality with full technical support, and it can be purchased by the given link. Clicking on the link will take you to the Internet resource, where the full version of the product can be purchased. After the payment, it is possible to download the product along with the unique code and all the necessary documentation.
Product Installation.
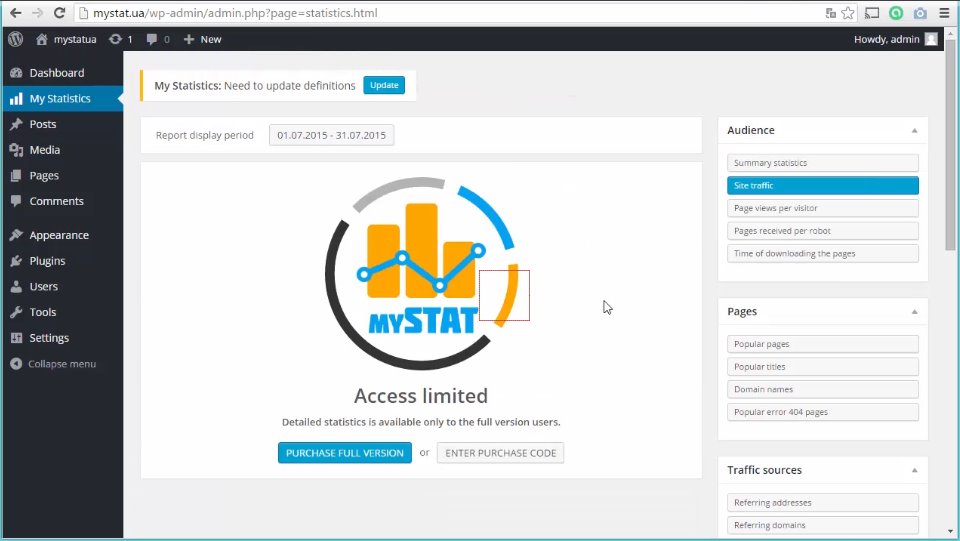
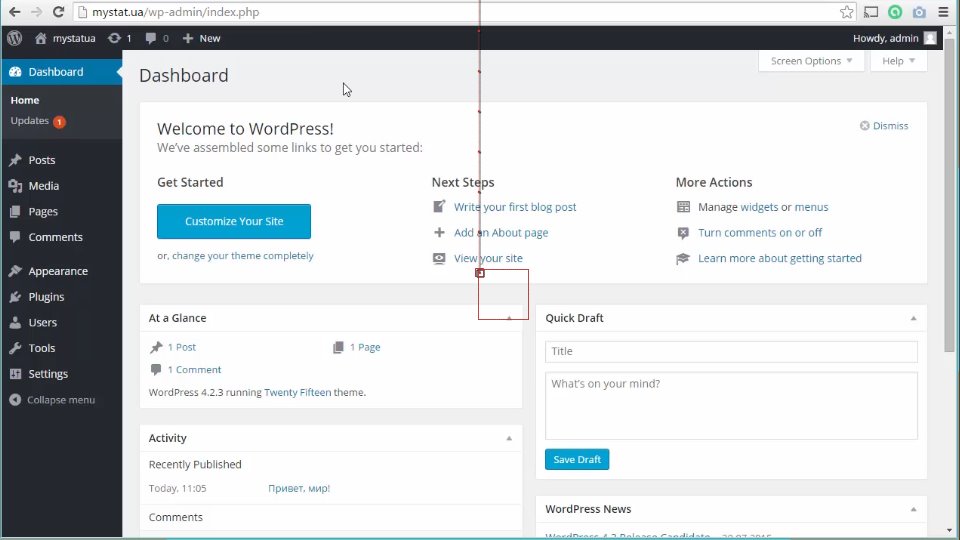
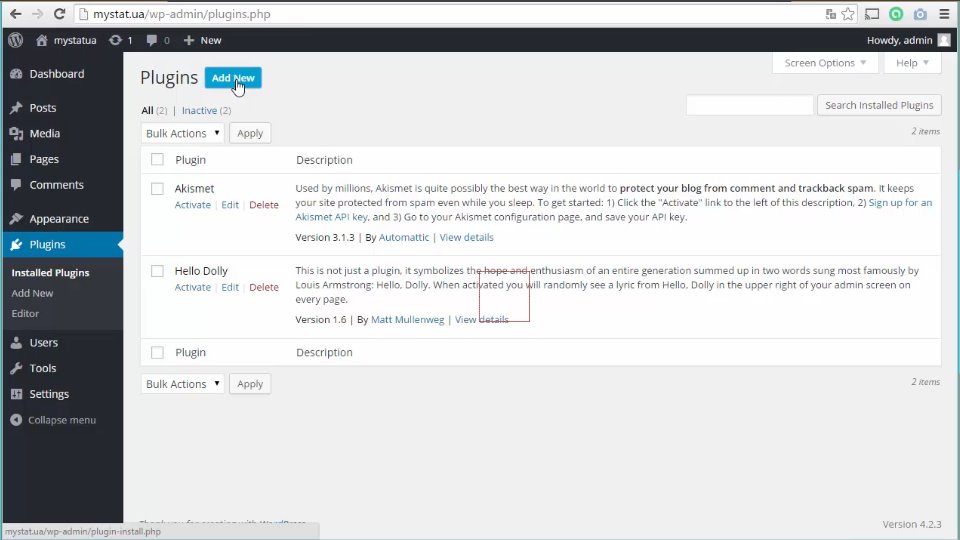
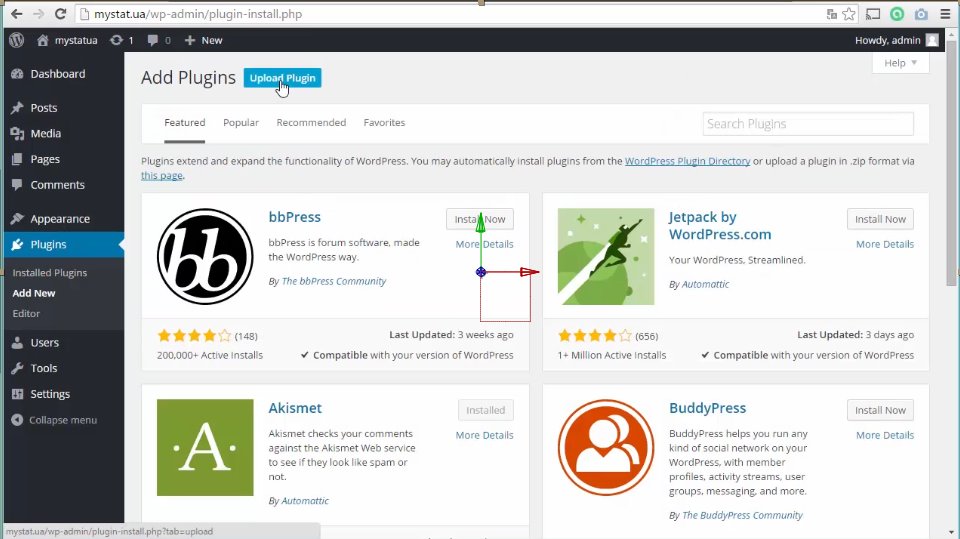
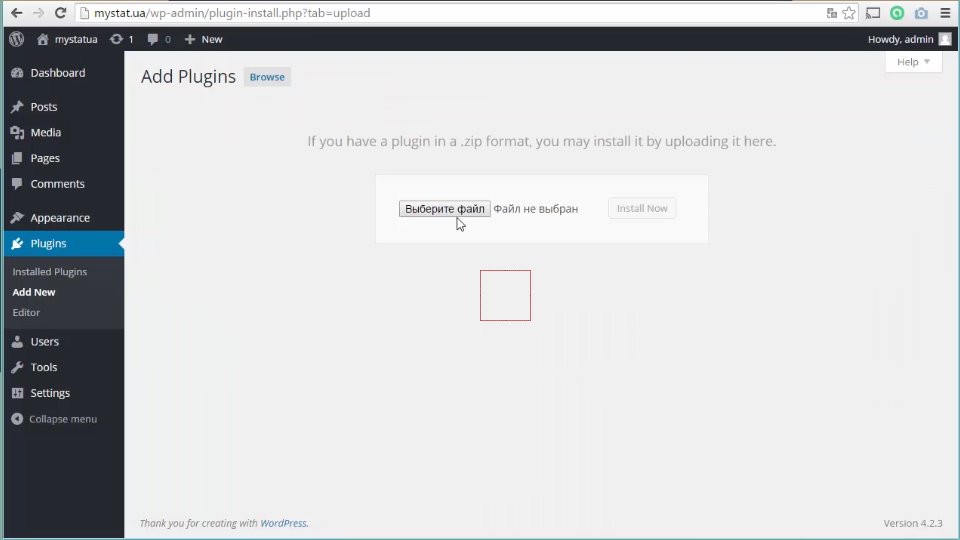
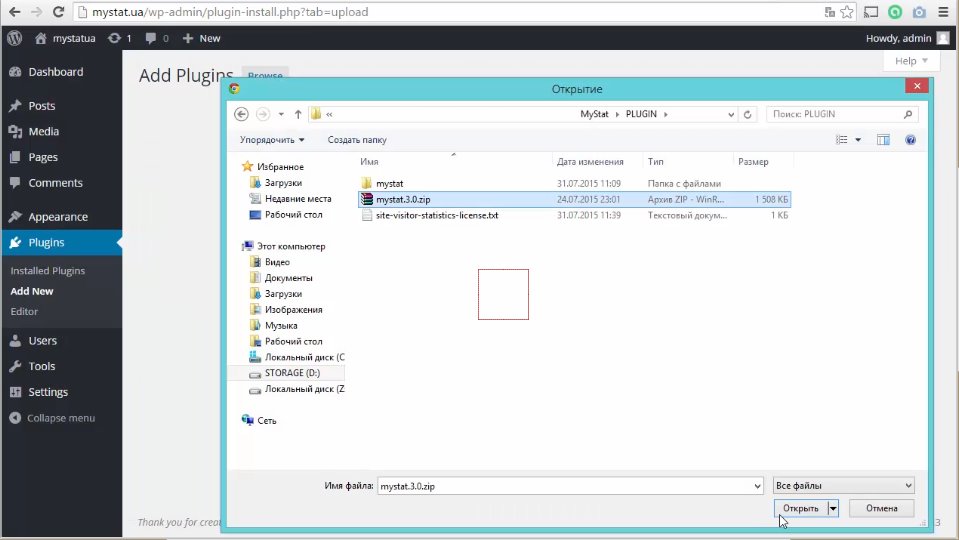
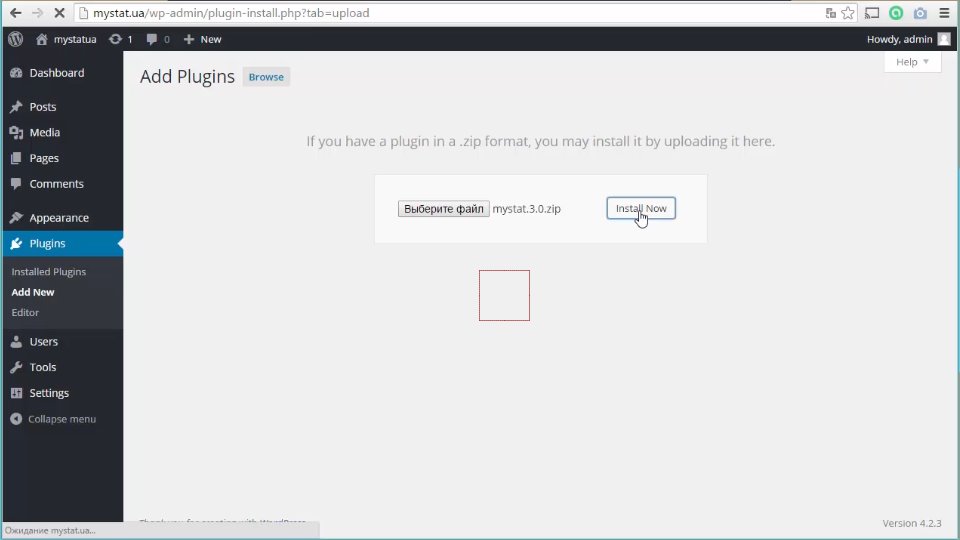
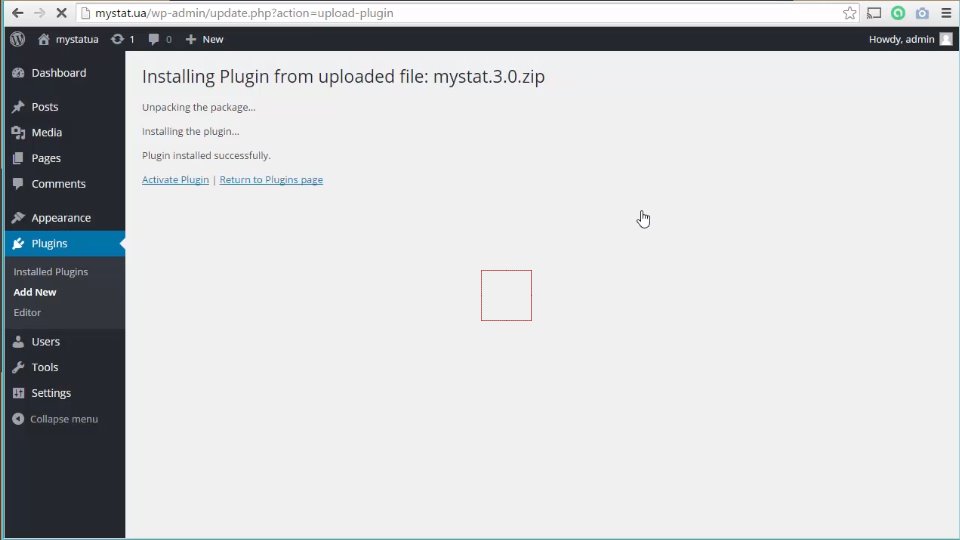
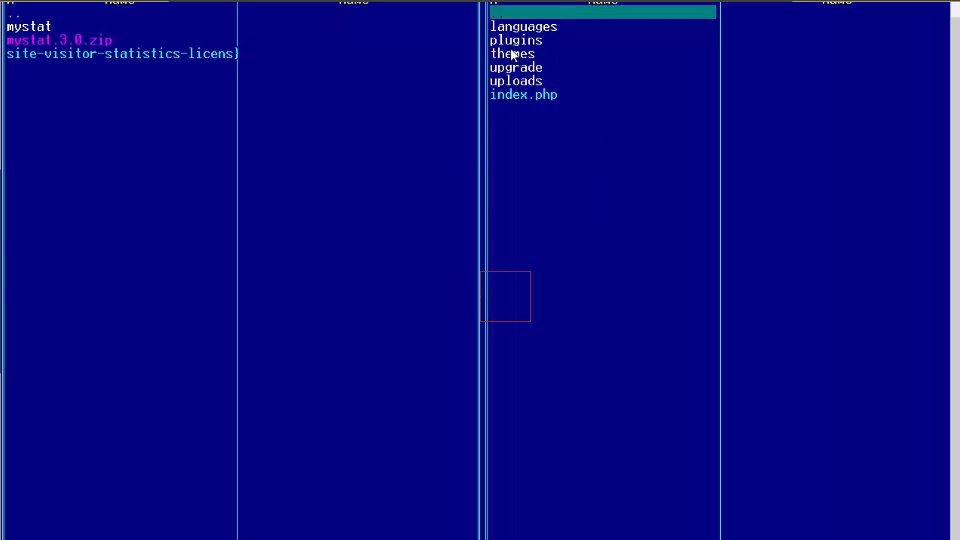
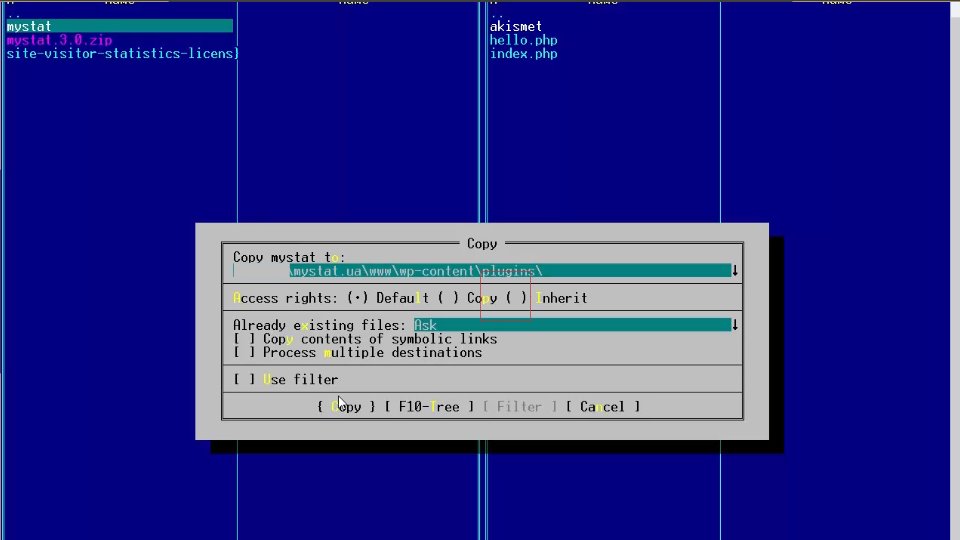
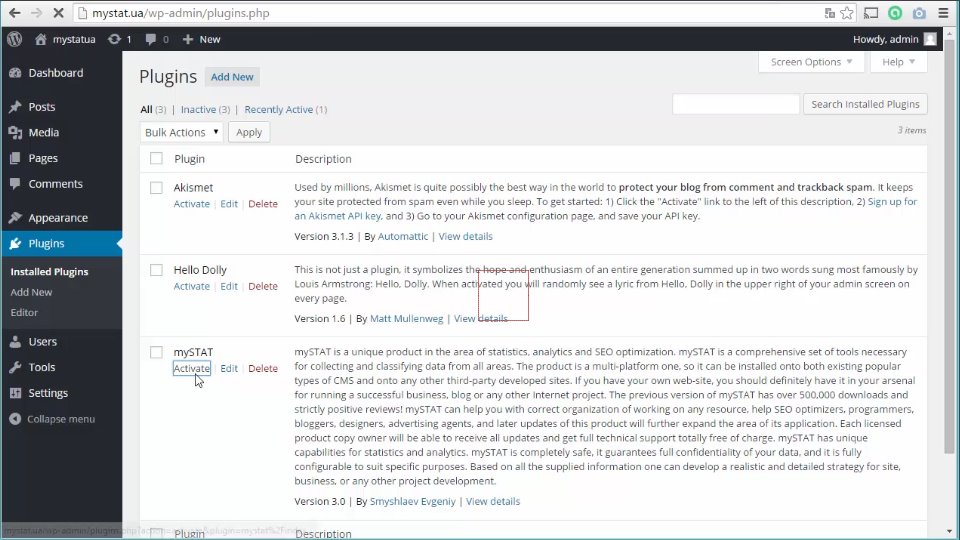
The plugin installation is performed in a standard fashion and there are two ways of doing it. The first way to install the product is to go to the plugins section of your site’s admin panel and press the button for adding a new plugin. Then we choose the command to download the plugin and locate the archive with the plugin or download it from WordPress repository. After the archive is downloaded, the plugin automatically appears in the section along with other plugins and it needs to be activated by pressing the corresponding button. The second way is applicable if you have access to ftp. In this case it is necessary to extract the folder with the plugin from the archive and simply put a copy of it into the plugin folder of your site and afterwards activate it from the plugin section of your administration panel.
Product Activation.
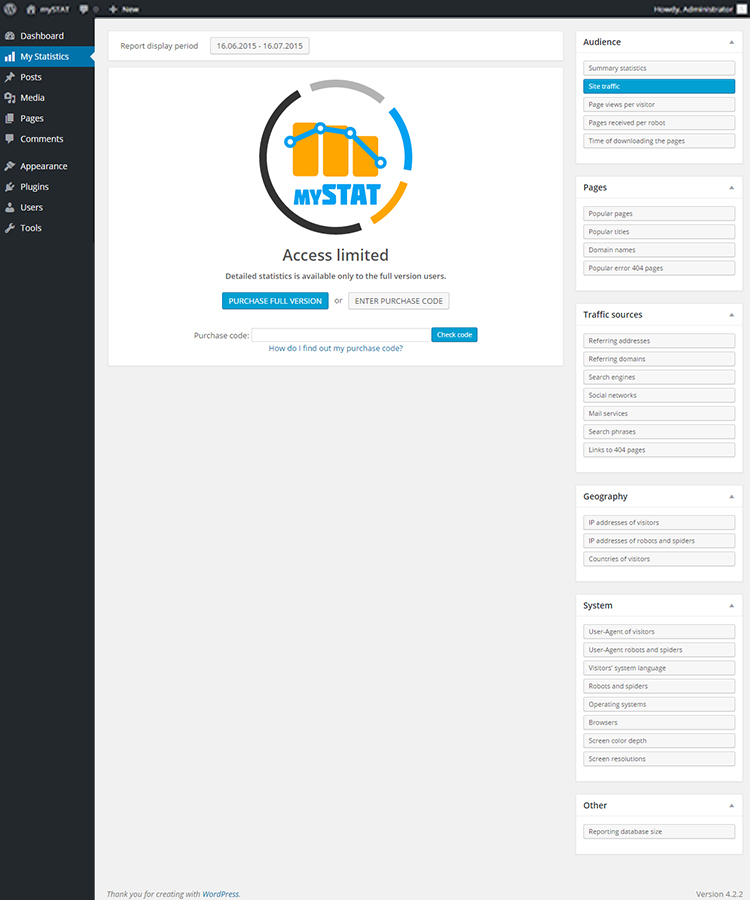
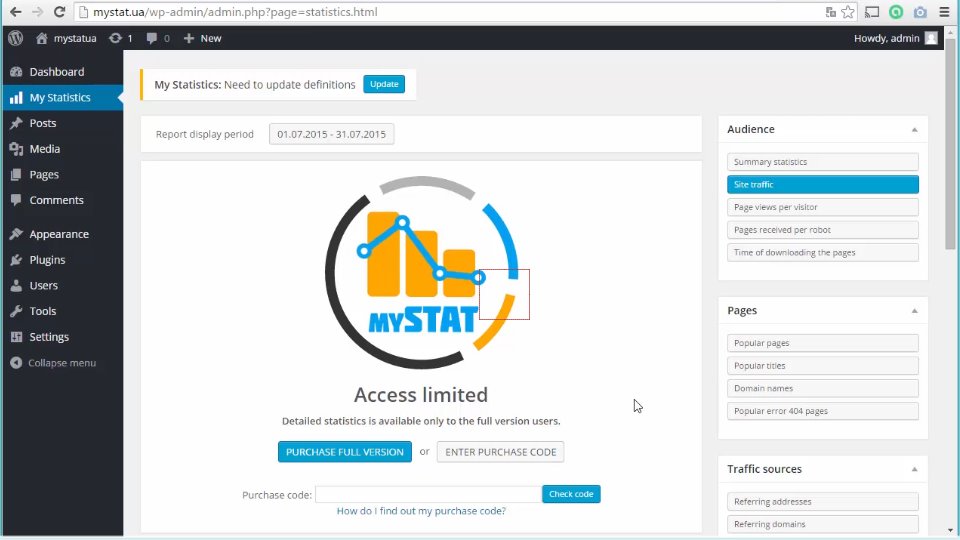
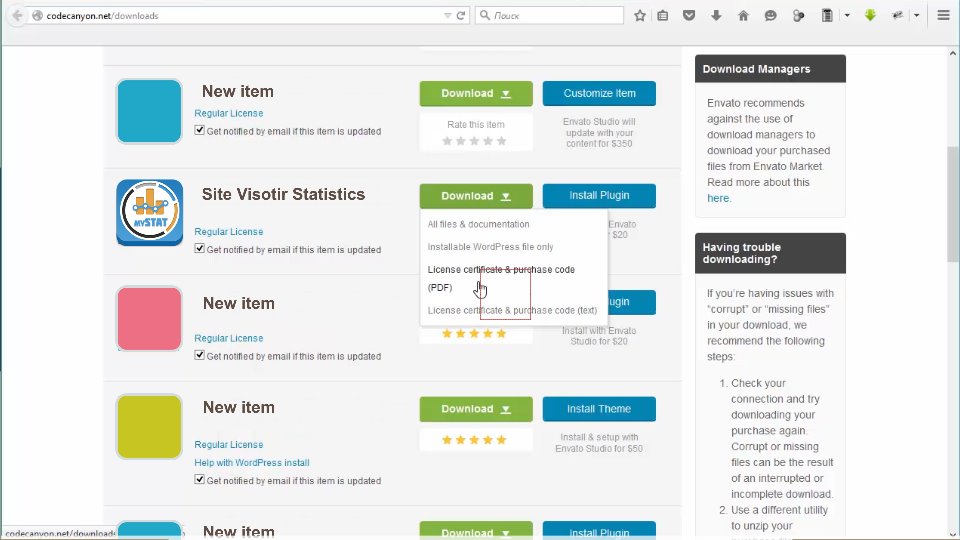
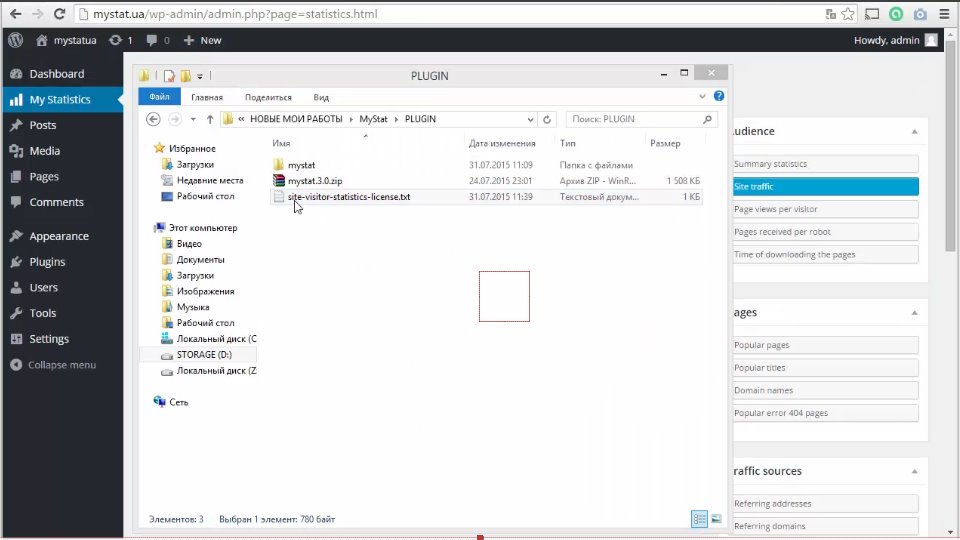
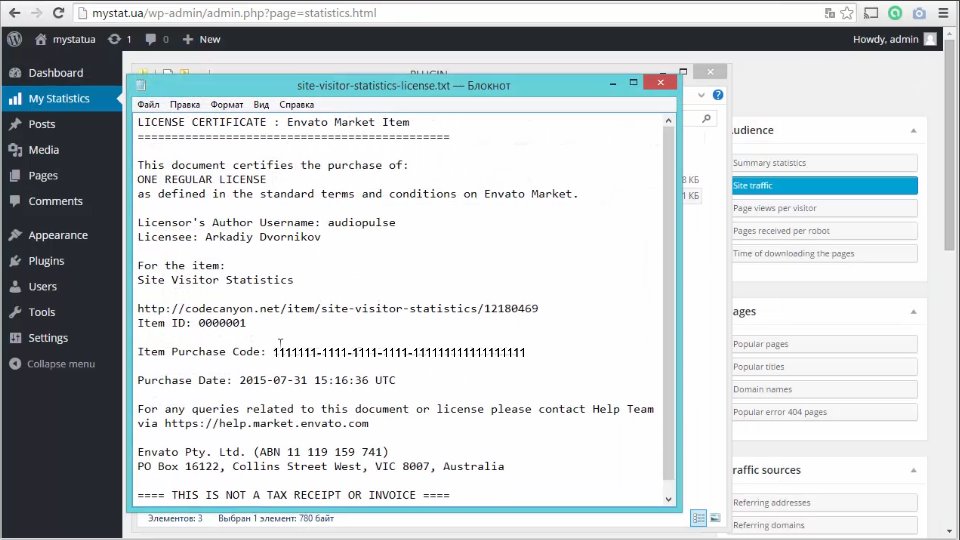
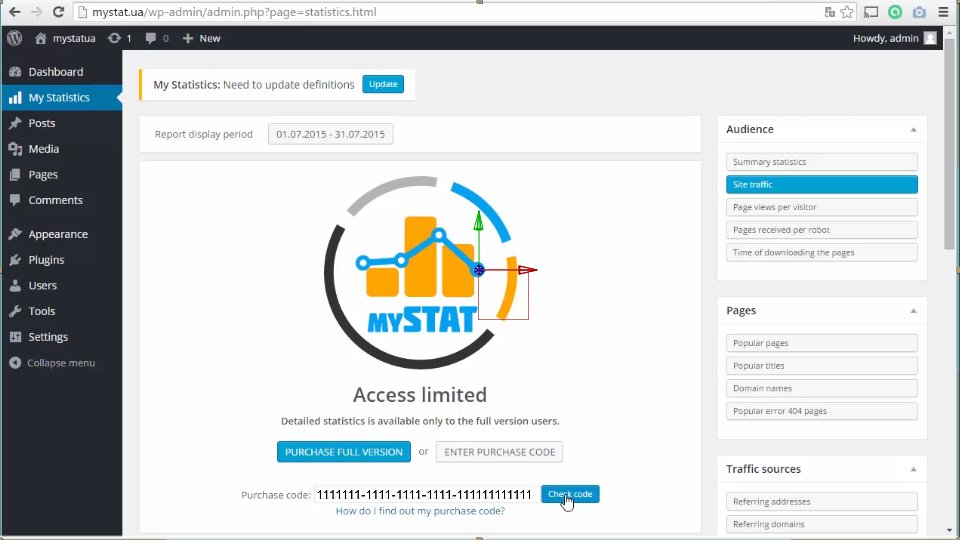
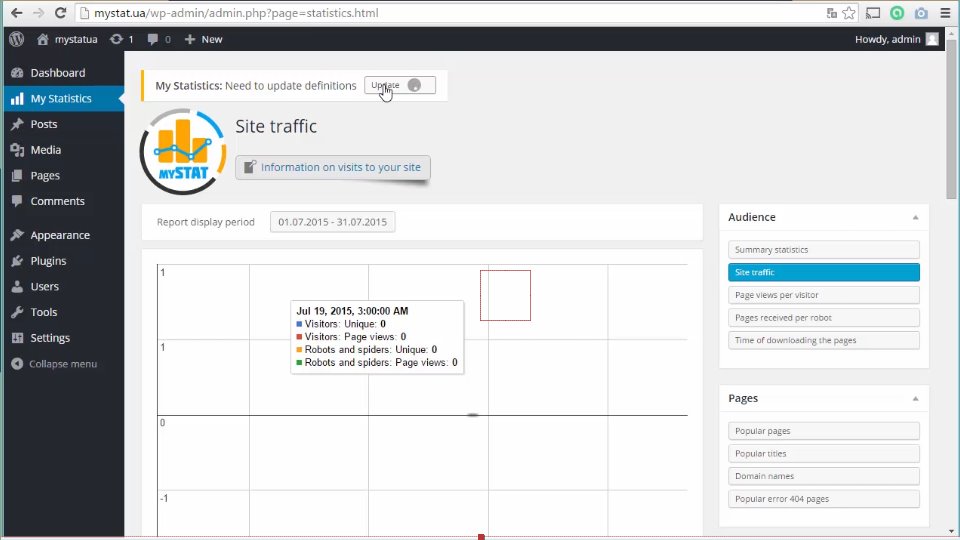
After the plugin activation, it is possible to go to its main page, which contains summary information on sections. Going to any other section is possible if you use a paid version of the product and have the unique code that confirms the purchase. When you click the button for any of the available sections, the system will ask you to enter your product code. Your unique code can be found and downloaded from your personal account, then you need to open the text file with the code, copy it and paste into the code field. After this product activation takes place. Then press the “update” button to load all the definition bases necessary plugin functionality to your server for fully local operation of the product without the use of any external sources.
Introducing the Product.
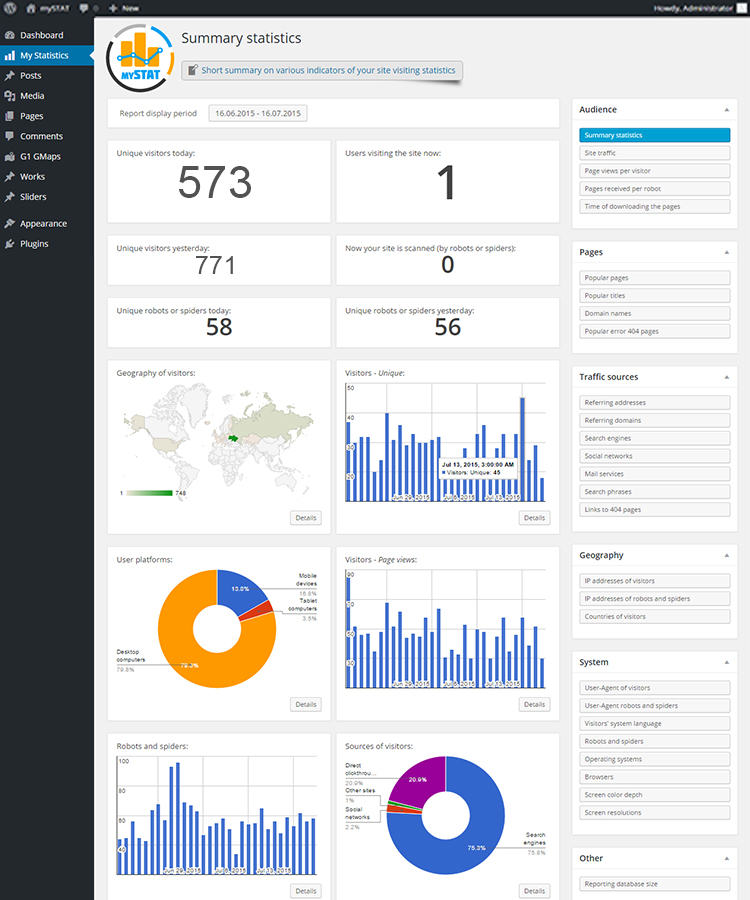
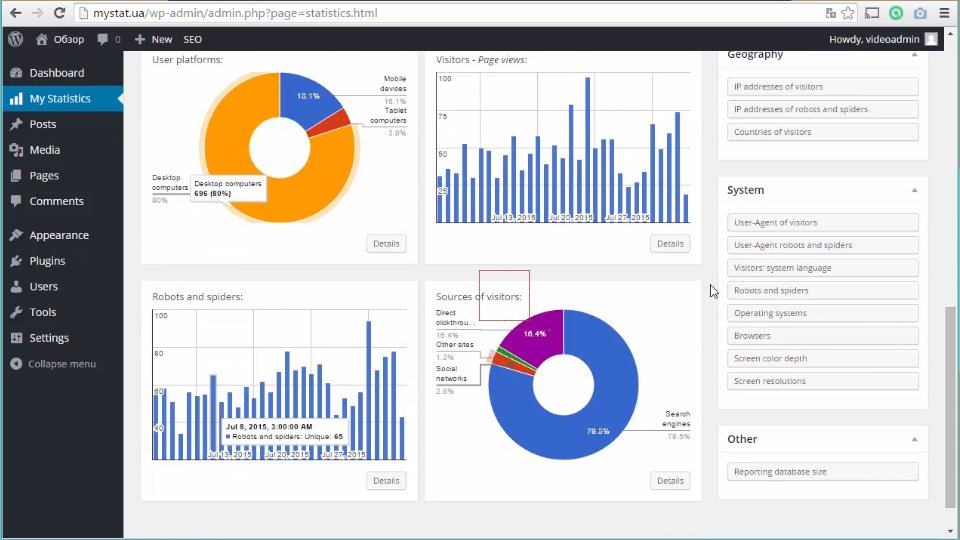
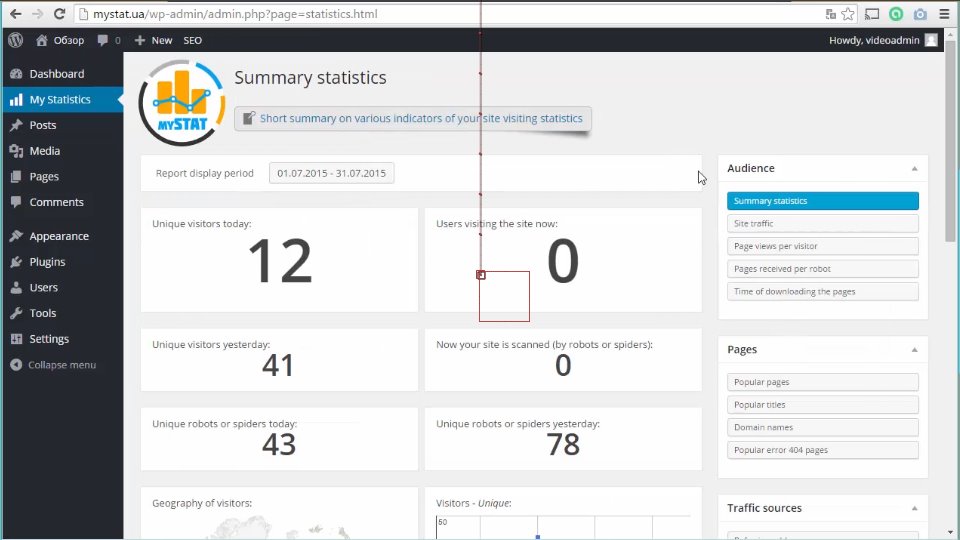
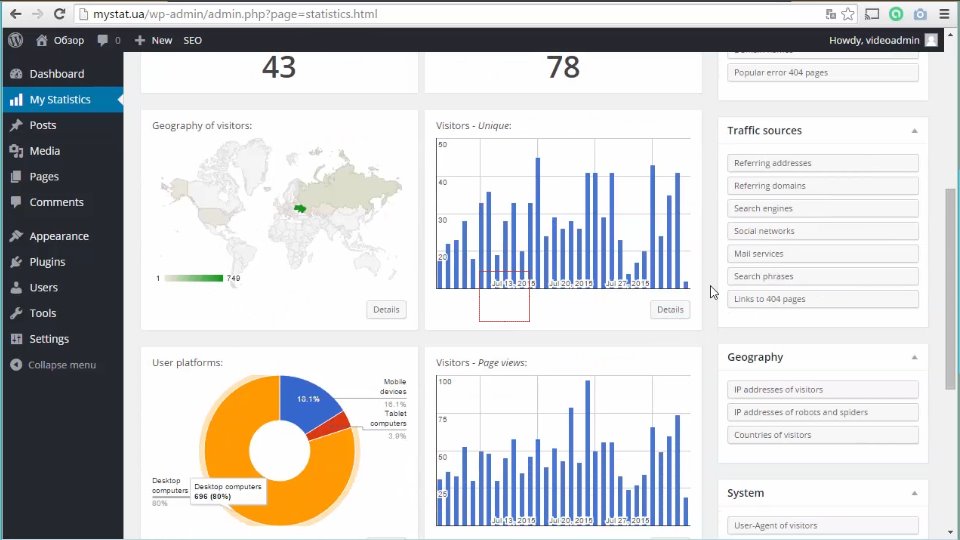
For more convenience the main page of the product is divided into two parts, where one part is a collection of summary information, some of which is visualized through graphic tiles, and the other part contains links in the form of buttons. Graphic tiles represent the following blocks:
– The block of selecting the displayed report period; (here you can select the required period for the report display – after the selection is made, press the “apply” button)
– Online users counter; (showing the number of users visiting your site at the moment)
– Online robots and spiders counter; (shows the number of robots and spiders scanning your site at the moment)
– Total number of robots and spiders for the past day;
– Total number of users for the current day;
– Total number of users, robots and spiders for the current day; (i.e. the total number of sessions that combine both real people and robots)
– Total number of robots and spiders for the current day;
– Geography of visitors; (these tiles additionally include the direct link to the corresponding section)
– Unique visitors;
– User platforms;
– Visitors: page views;
– Robots and spiders;
– Sources of visitors.
Product Sections and Categories.
Section: Audience.
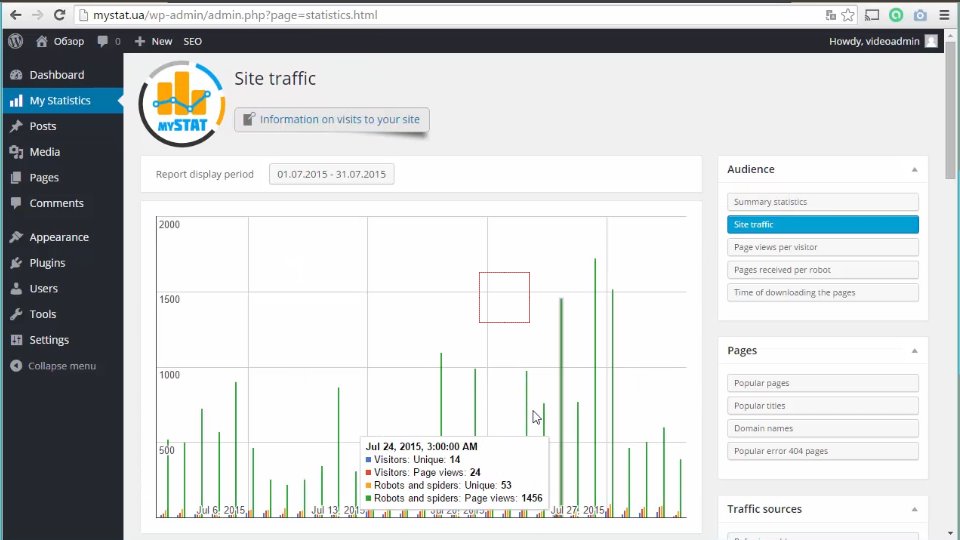
Site traffic.
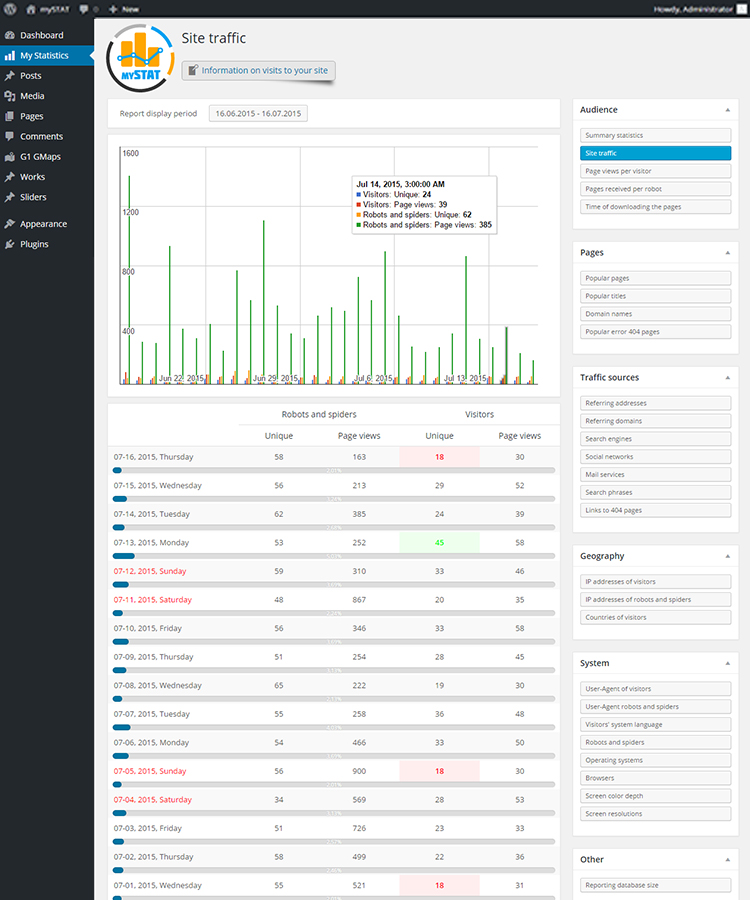
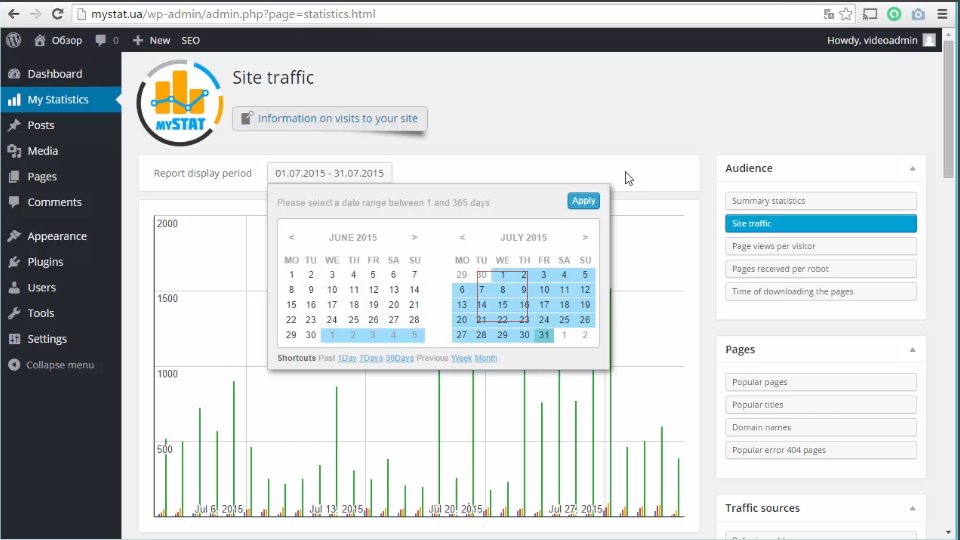
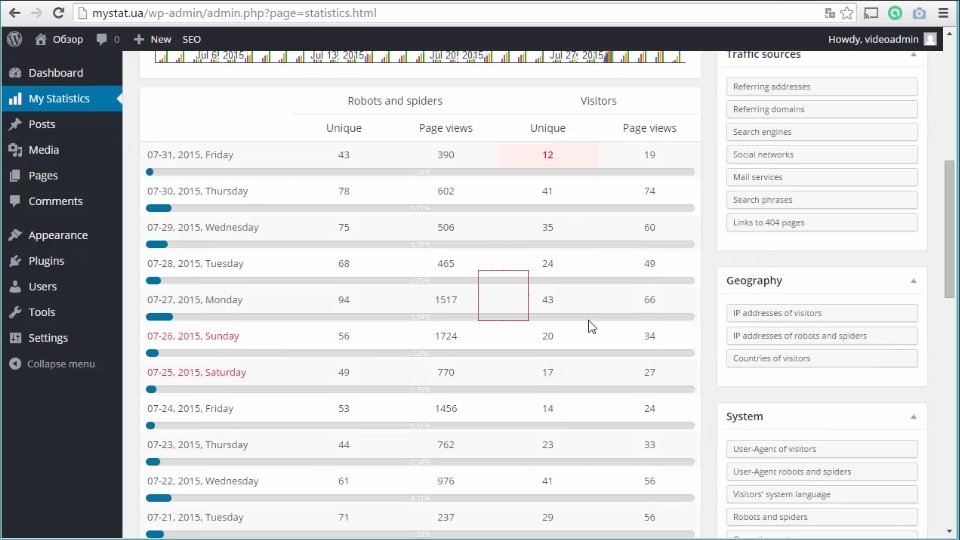
This section provides the most complete and detailed report on your website visitors. The diagram version allows for the analysis of the visits statistics, even by the hour, to show when the traffic is the maximum and the most efficient. It presents data on unique visitors, page views by visitors, unique robots and spiders, as well as page views by robots and spiders. The information is also presented as a list, which can also be used for fast analysis of the necessary data.
Page views per visitor.
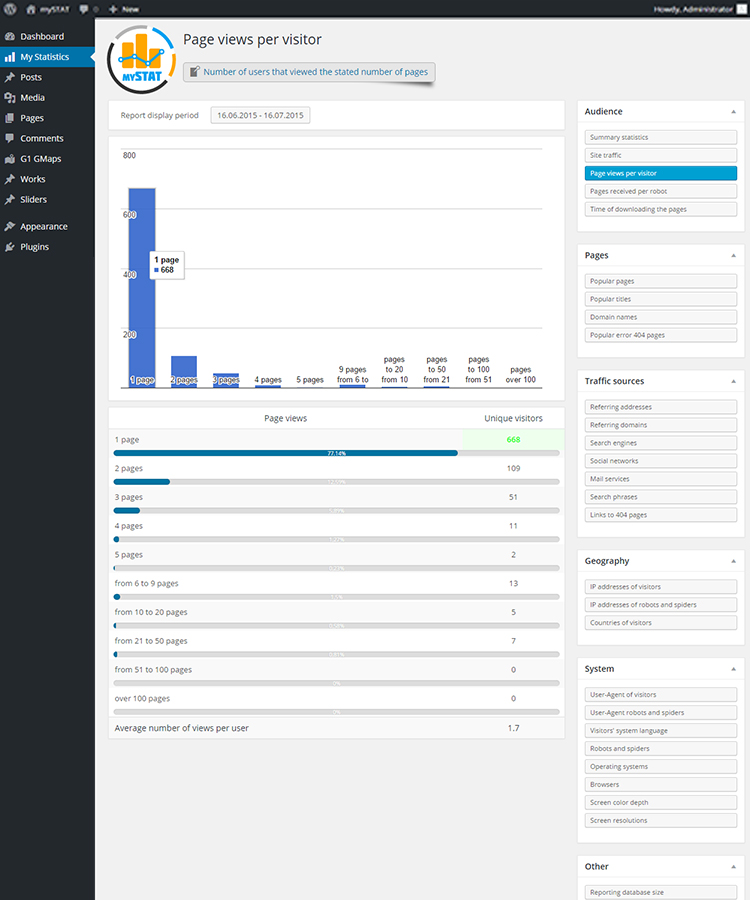
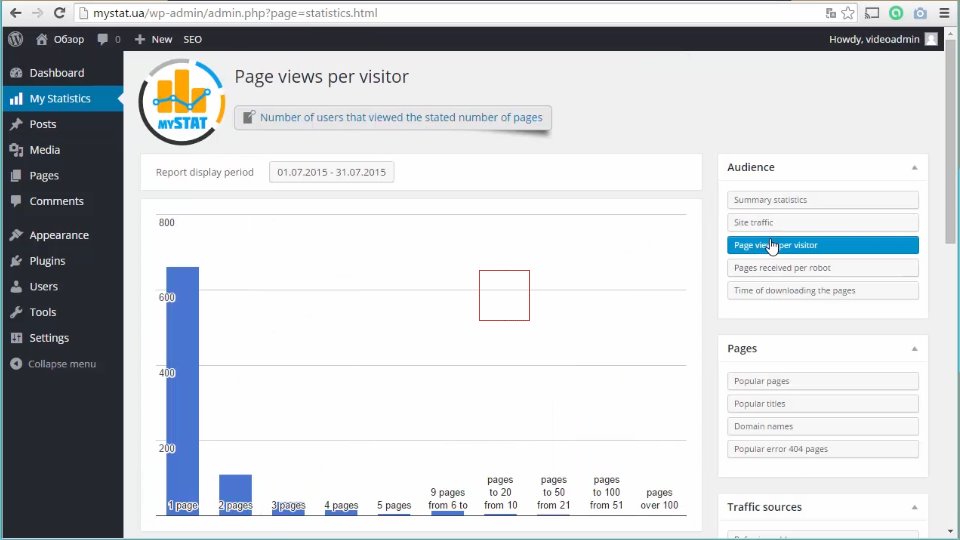
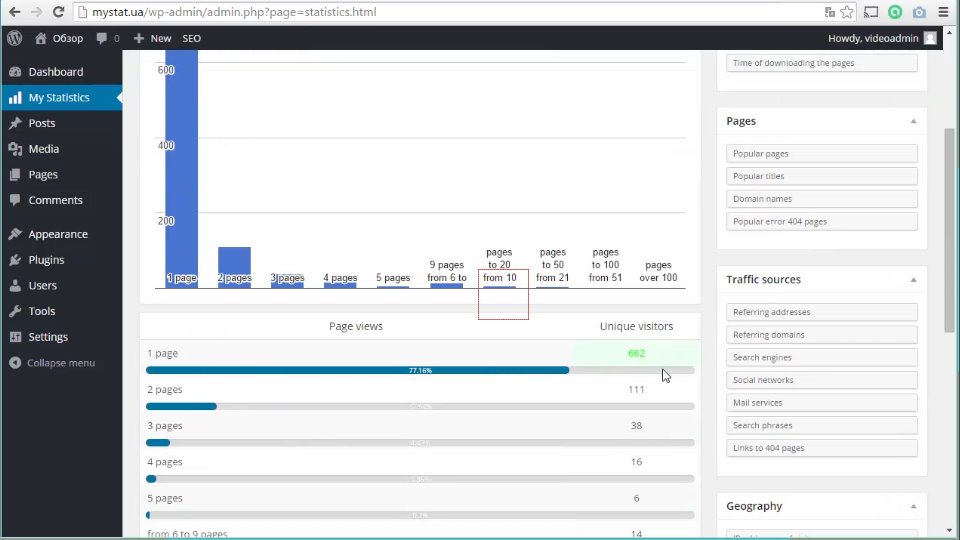
It also provides a convenient diagram and a list. This section contains views per host. It provides detailed statistics on how many pages are viewed by one person and the total number of such people. It’s safe to say that the higher the figures in this table are, the better and more attractive your site is for customers or users.
Pages received per robot.
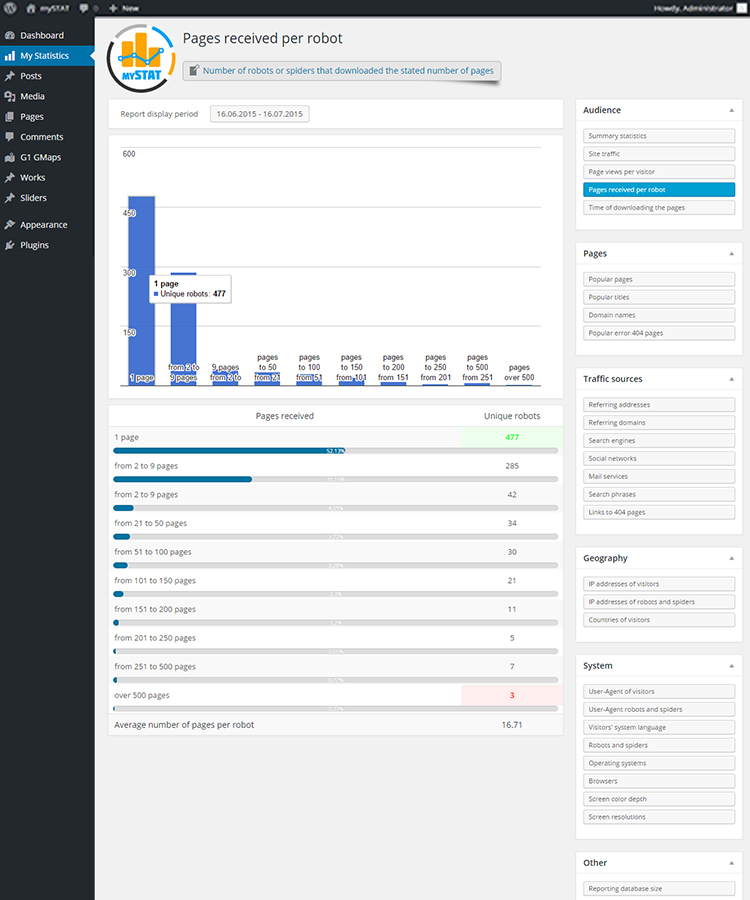
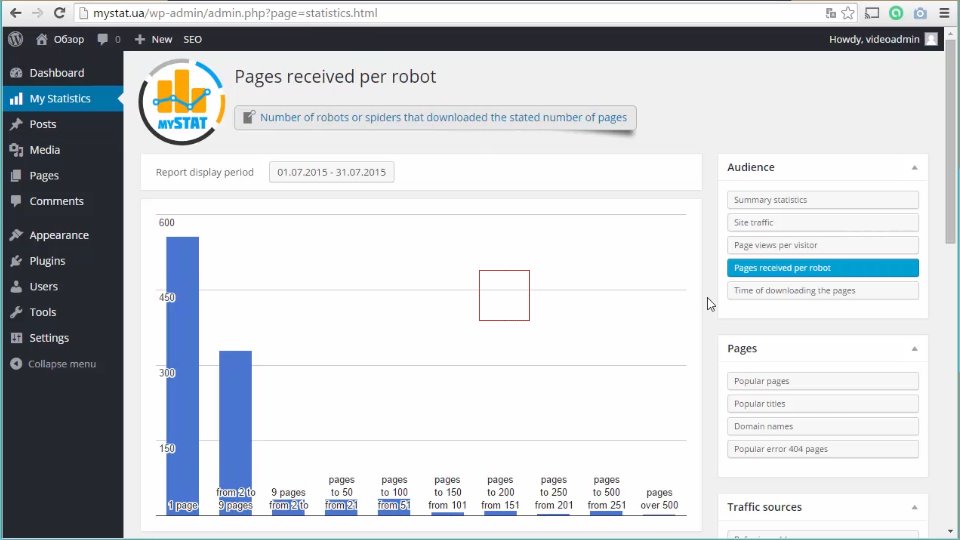
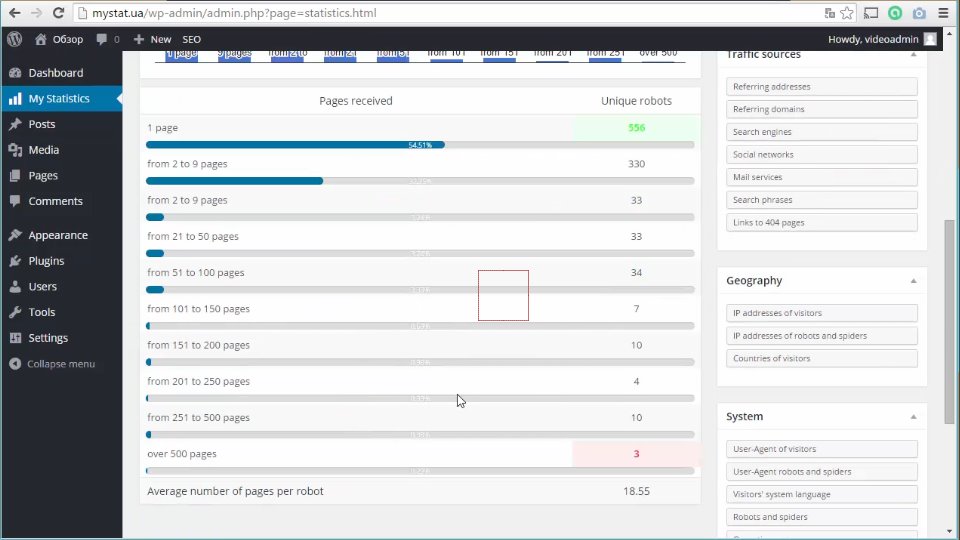
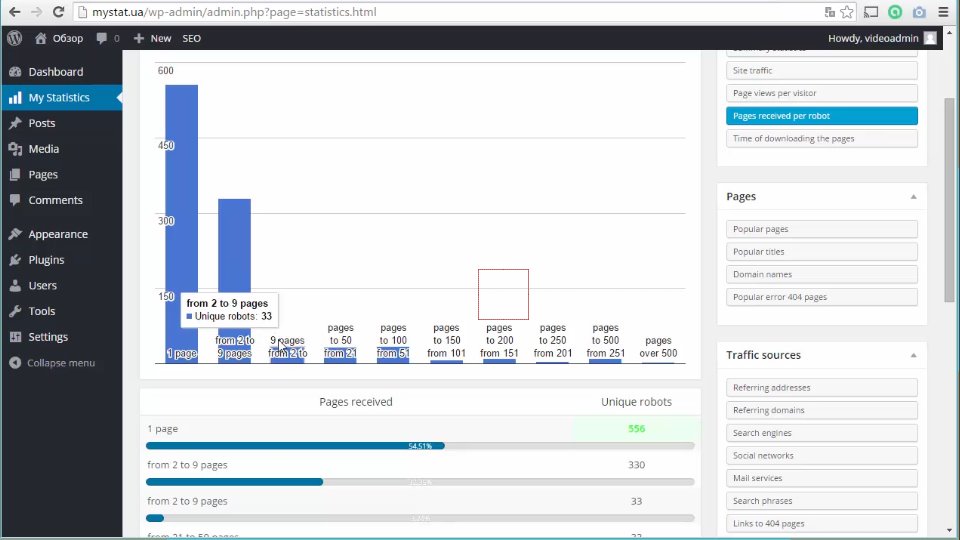
The next section is quite important and deals with pages received per robot. Detailed statistics on how many pages are viewed by the robot. Here you can learn how interesting your site information is for robots based on the number of pages scanned by robots.
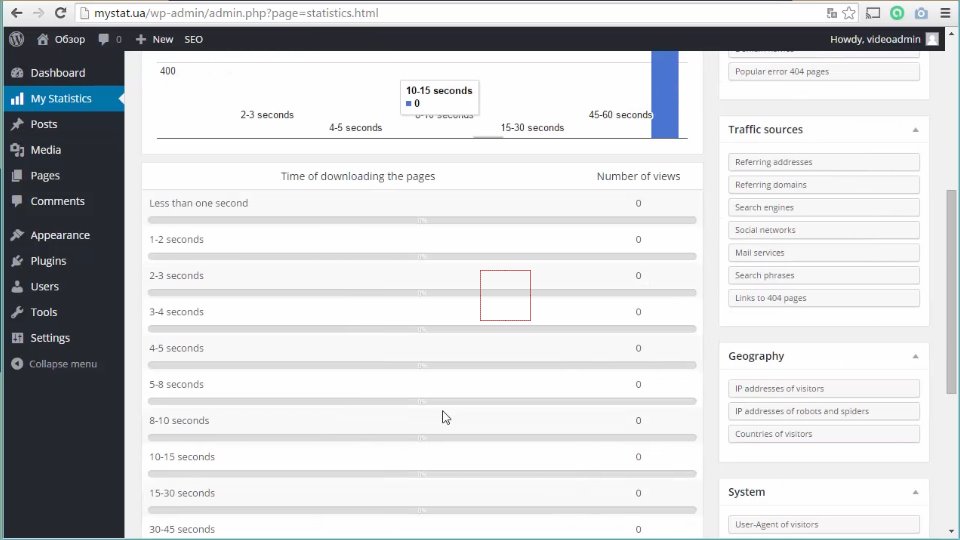
Time of downloading the pages.
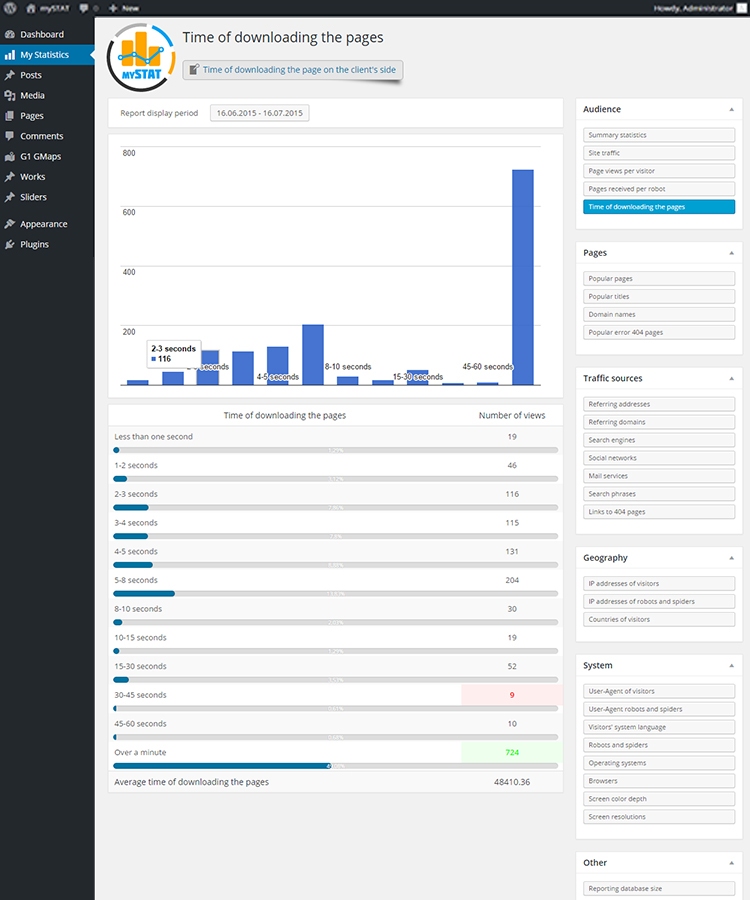
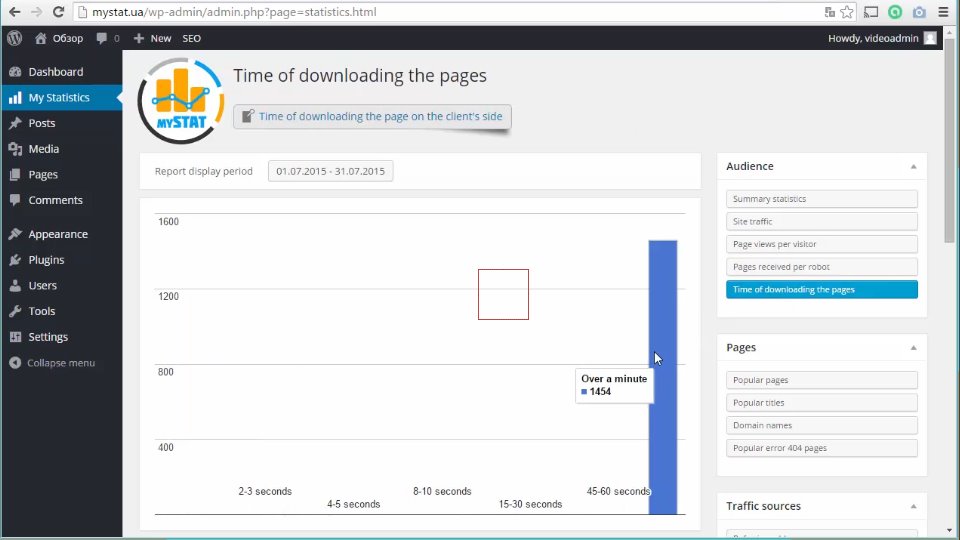
The next section deals with the speed of downloading your pages. The actual data on how much time passes between the moment the user starts loading the page and the moment it is downloaded and displayed. Both programmers and designers can use the data to make proper adjustments in the code and appearance of your site.
Section: Pages.
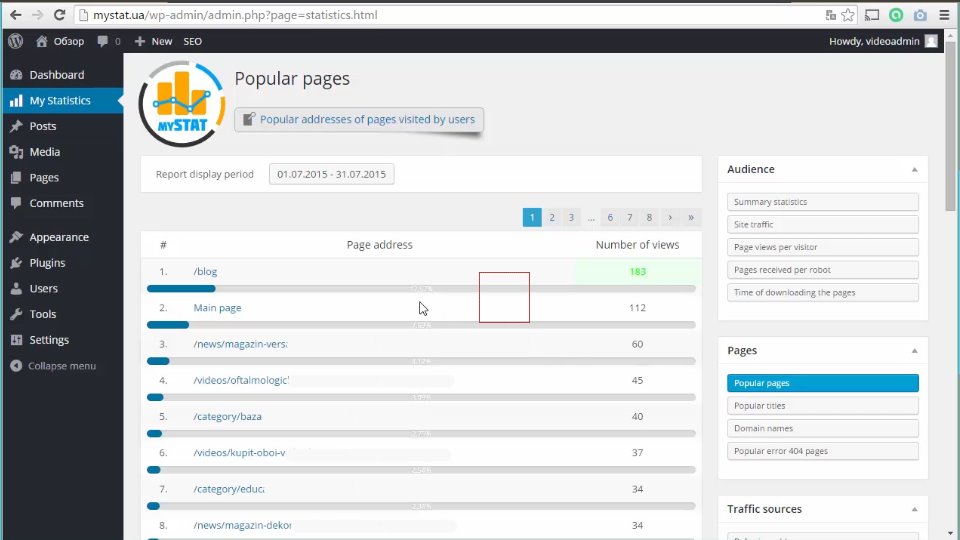
Popular pages.
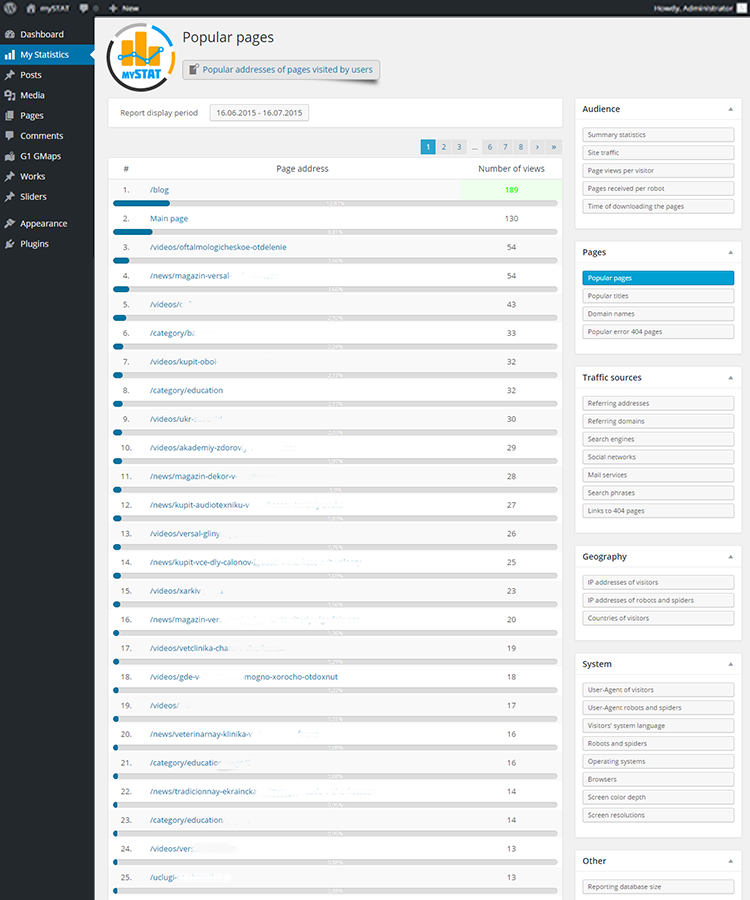
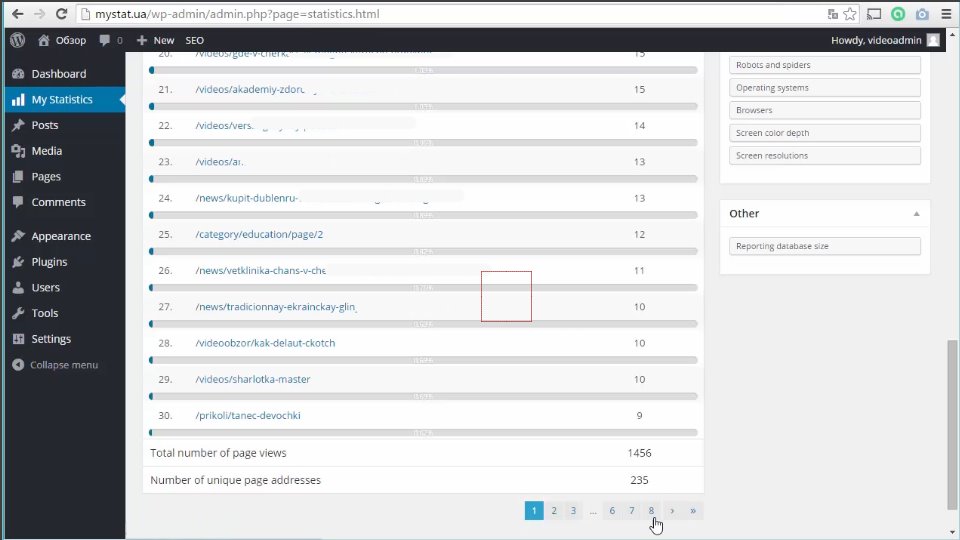
This section provides information on popular pages of your site, or, to be more precise, it lists the addresses of your site pages most often visited by the users. This information can help to correctly identify what users like most and provide the required information accordingly.
Popular titles.
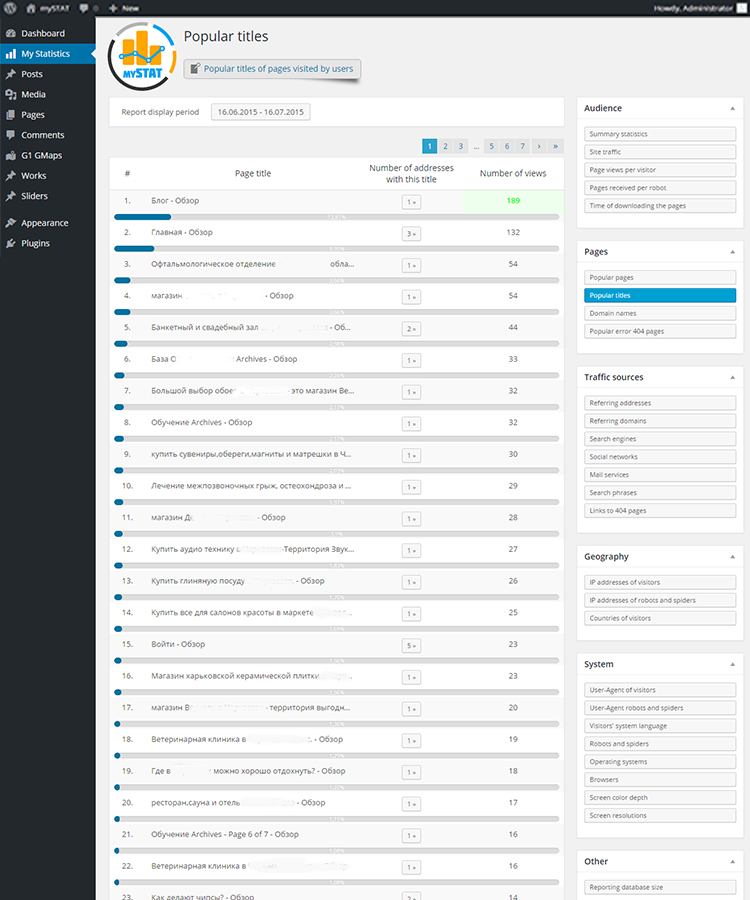
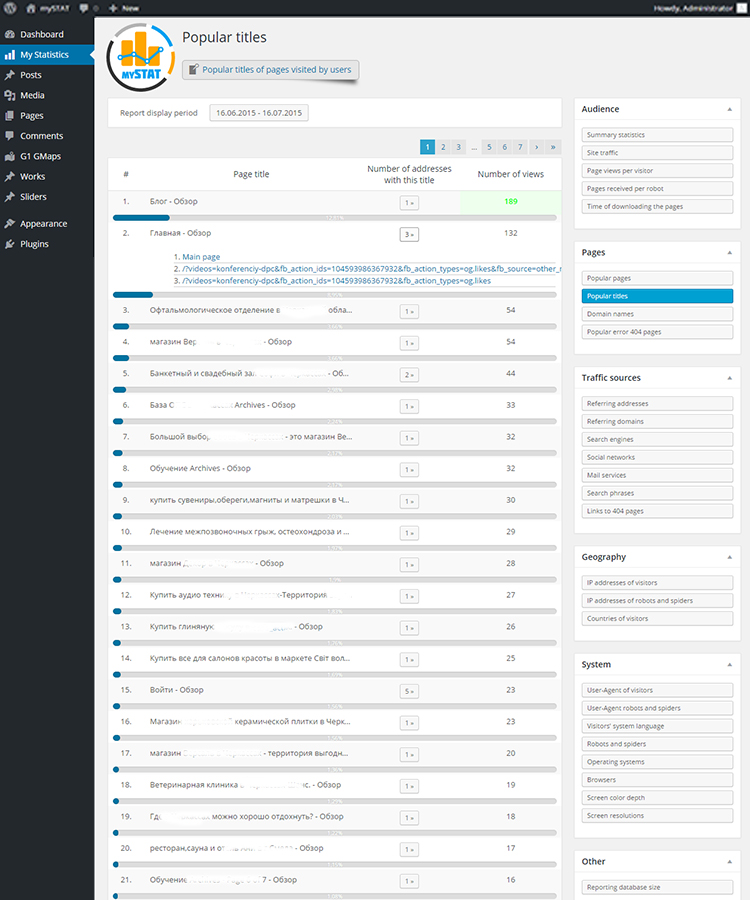
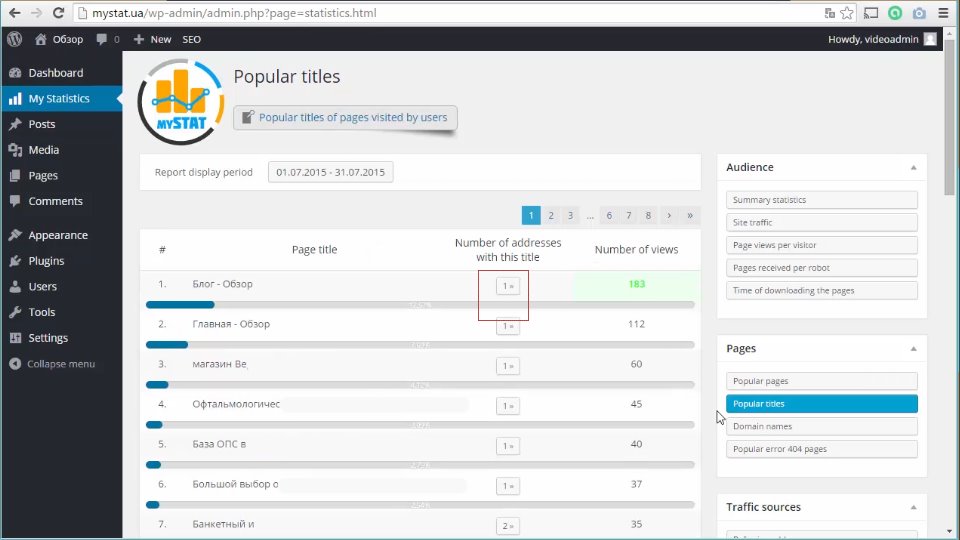
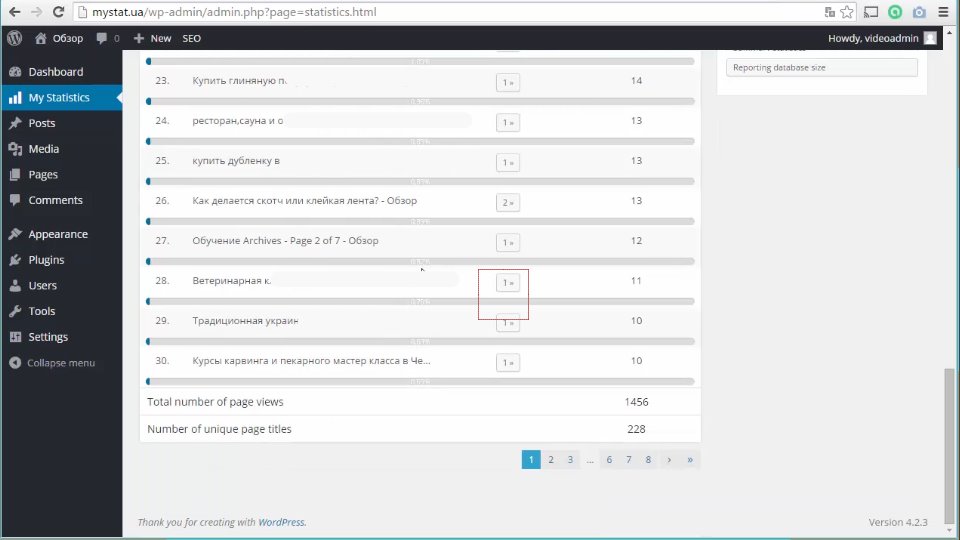
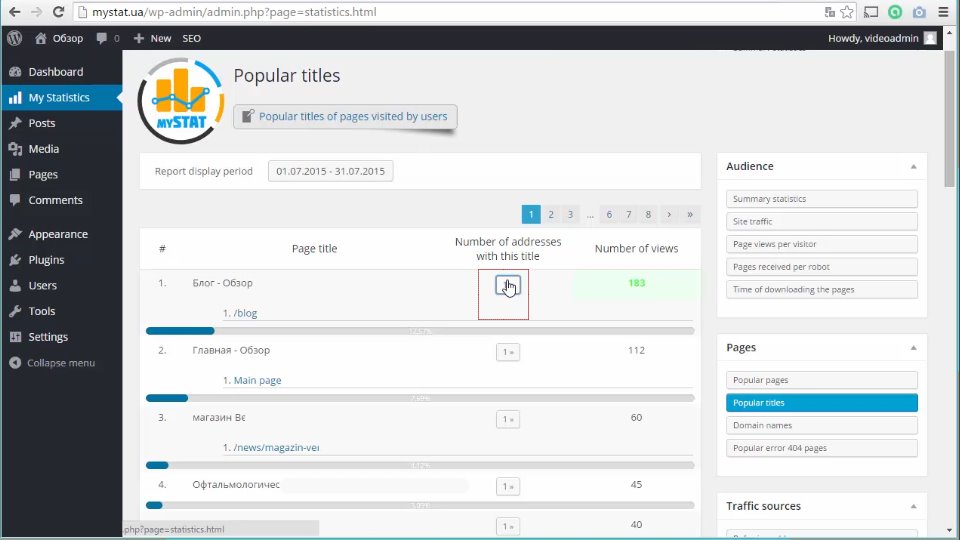
This special section for the rating of page titles most visited by users. It will help SEOs and other optimizers to identify incorrect page titles and duplicate titles on different pages. By clicking here you can also see the address of the page itself.
Domain names.
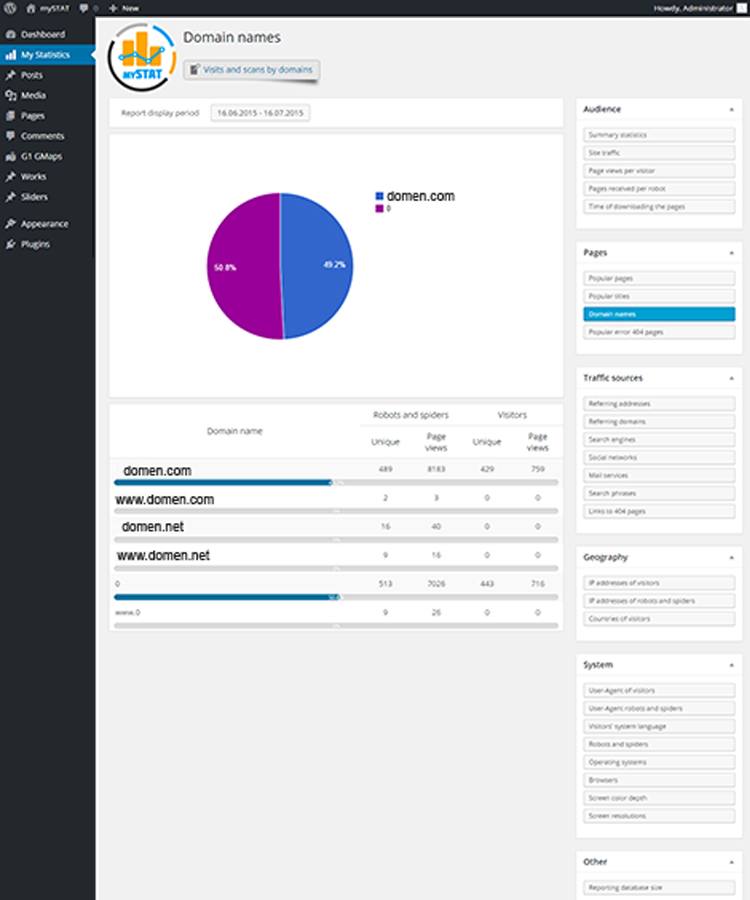
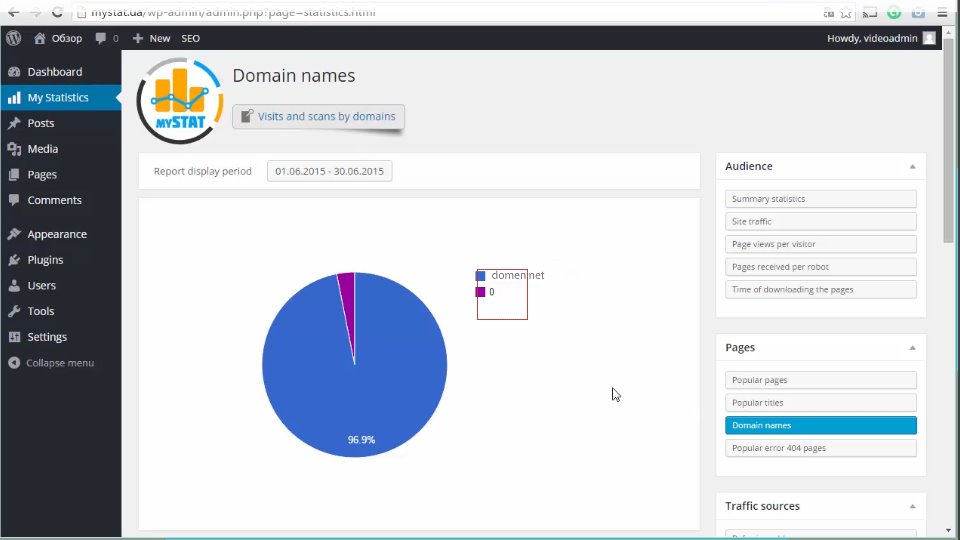
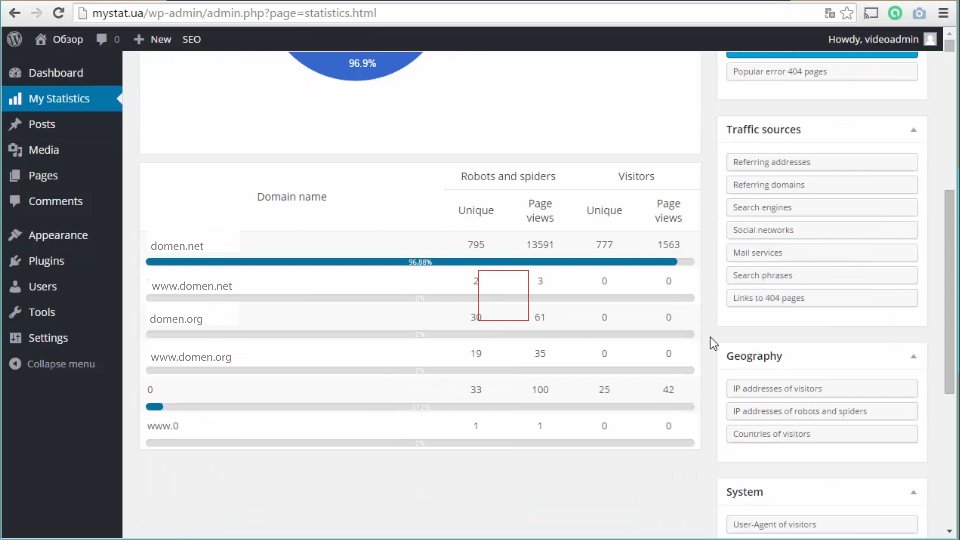
If several different domains are connected to your site, this information will help to determine the most popular domain. That would be the domain, through which viewers visit you most often.
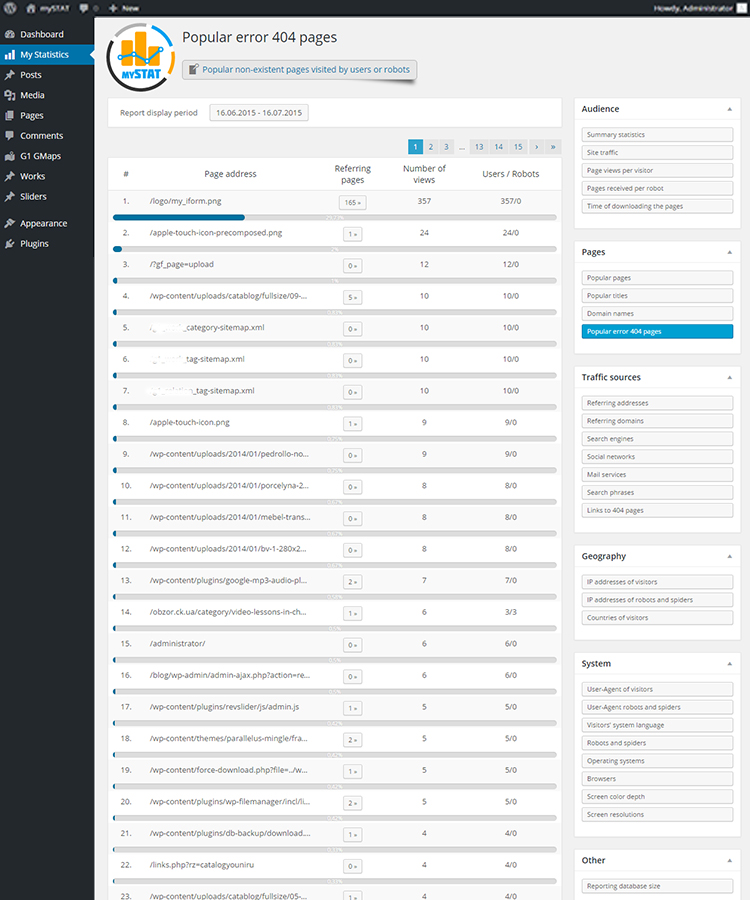
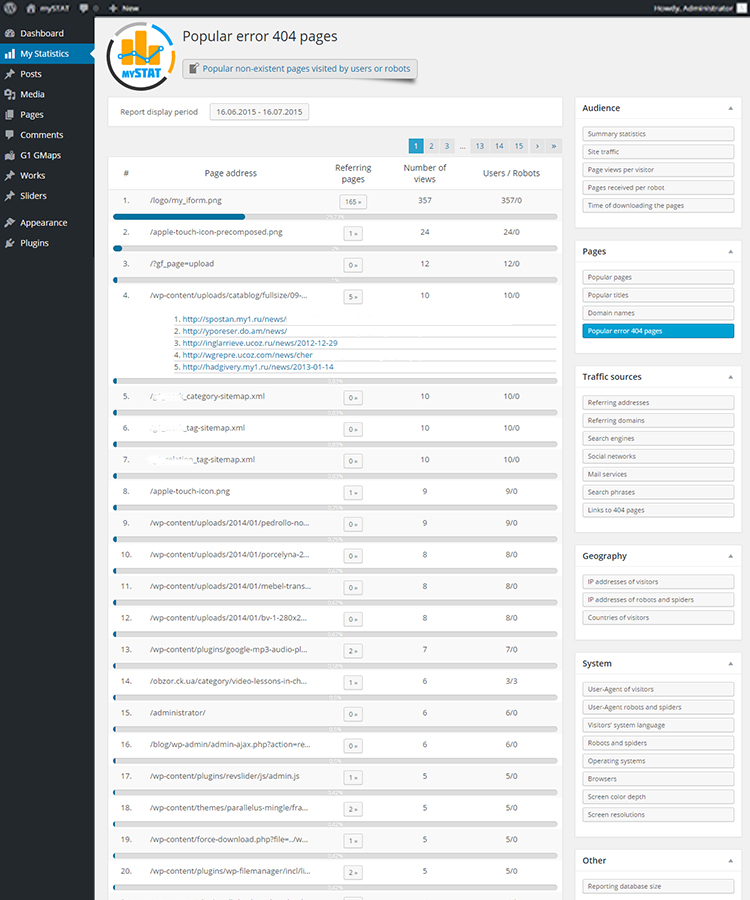
Popular error 404 pages.
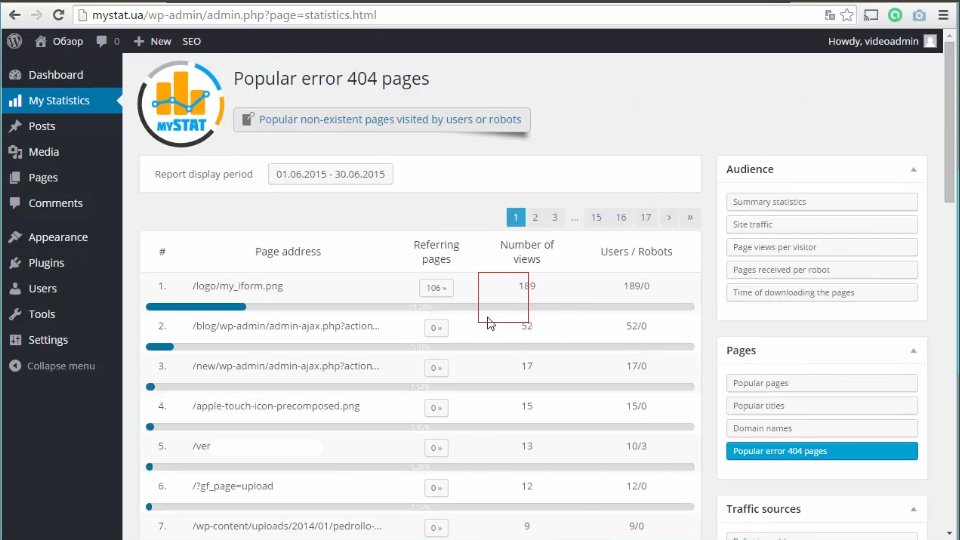
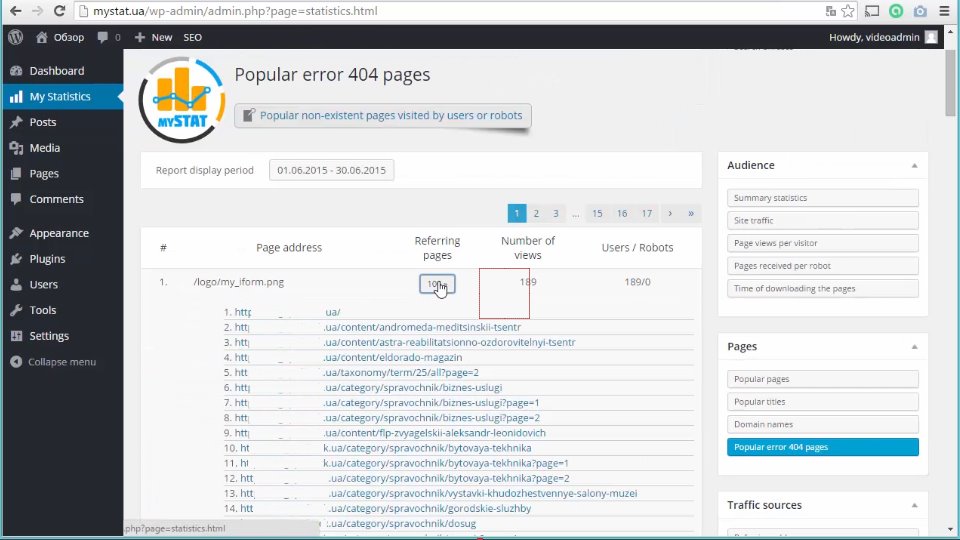
The next section deals with 404 pages. These are pages that do not exist on your site, but for some reason they are visited by search engines, people or robots. This section is also quite important for analysis. Third-party services do not monitor this information, yet it is very important for a site owner. Using these pages you can figure out who or what collects information on your website, as a rule it is crawlers or spiders. For example, if you see a lot of hits on such a page, it may mean that the site is scanned and monitored. The scanning may be aimed at finding vulnerabilities, standard security gaps of the site, possibilities for unauthorized access to your site or a way to introduce a malicious code. This information will be useful for administrators and programmers and it can help reveal hidden threats before they are implemented.
Section: Traffic sources.
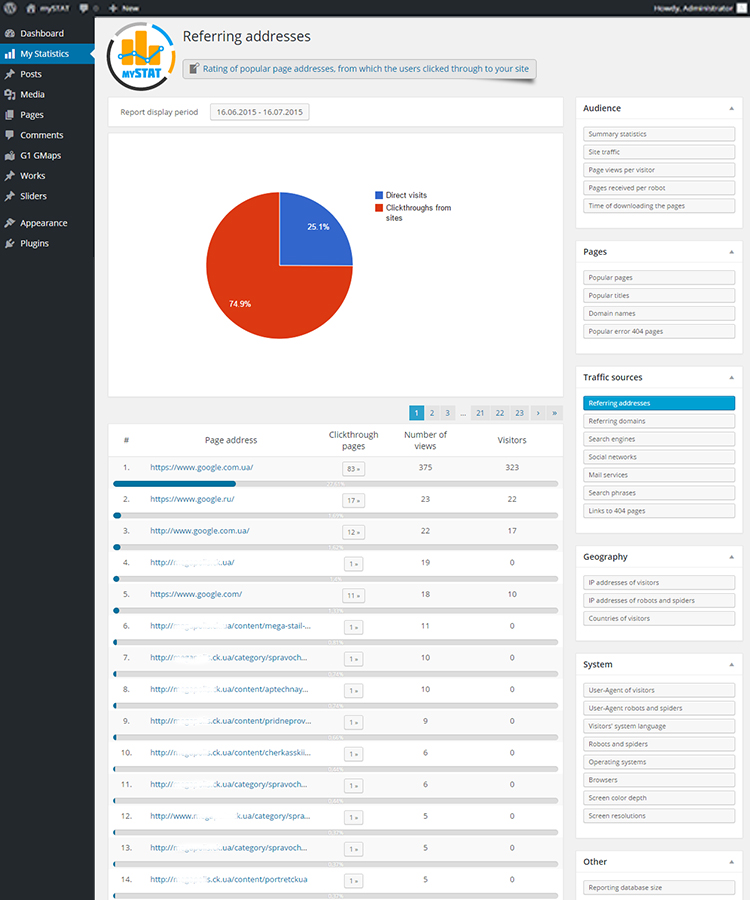
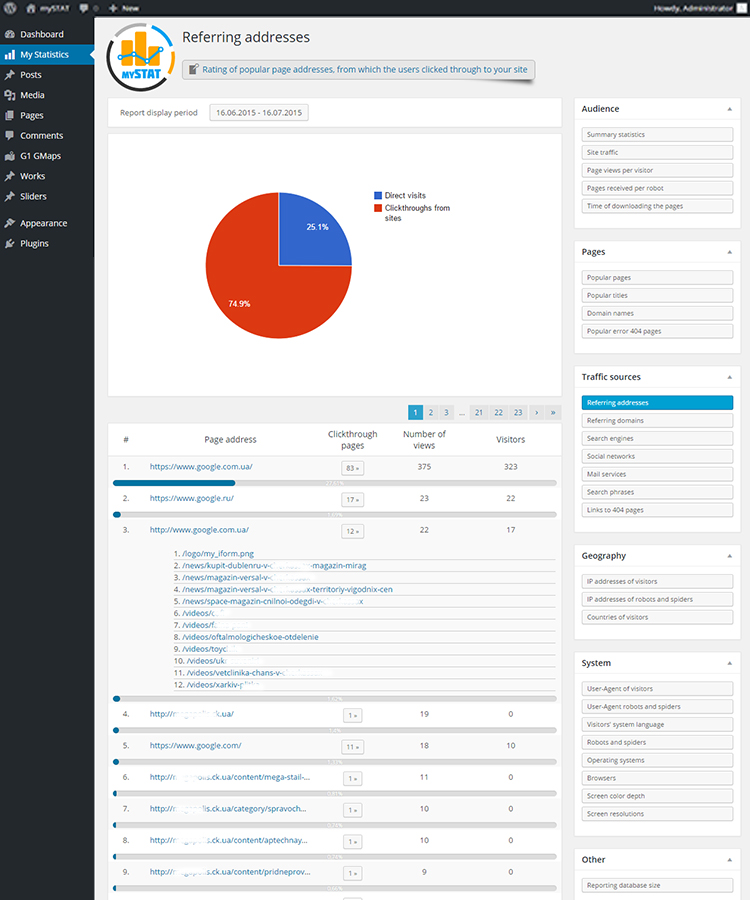
Referring addresses.
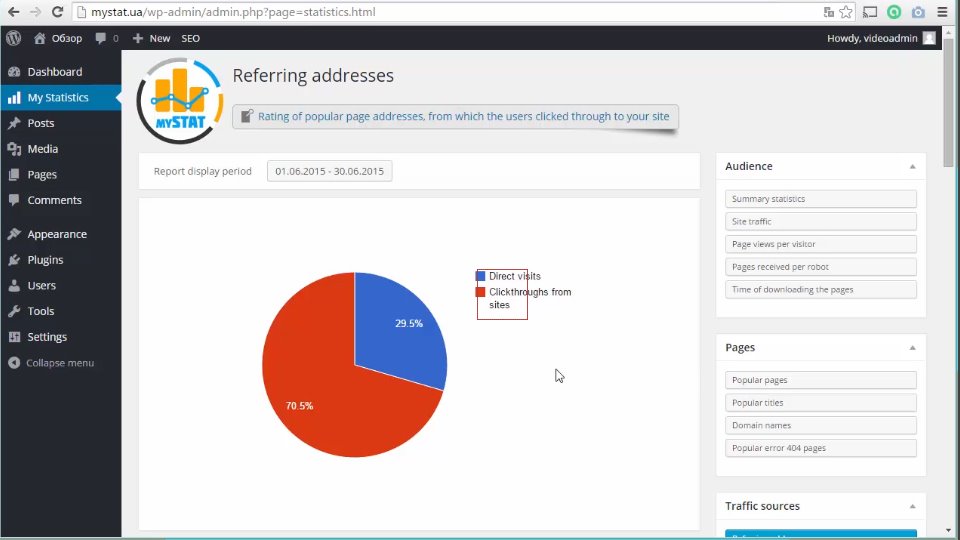
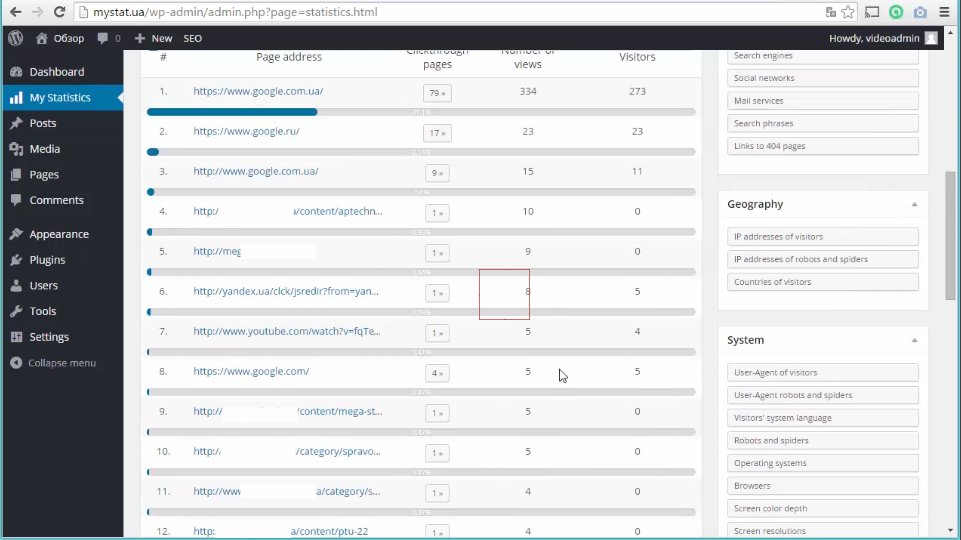
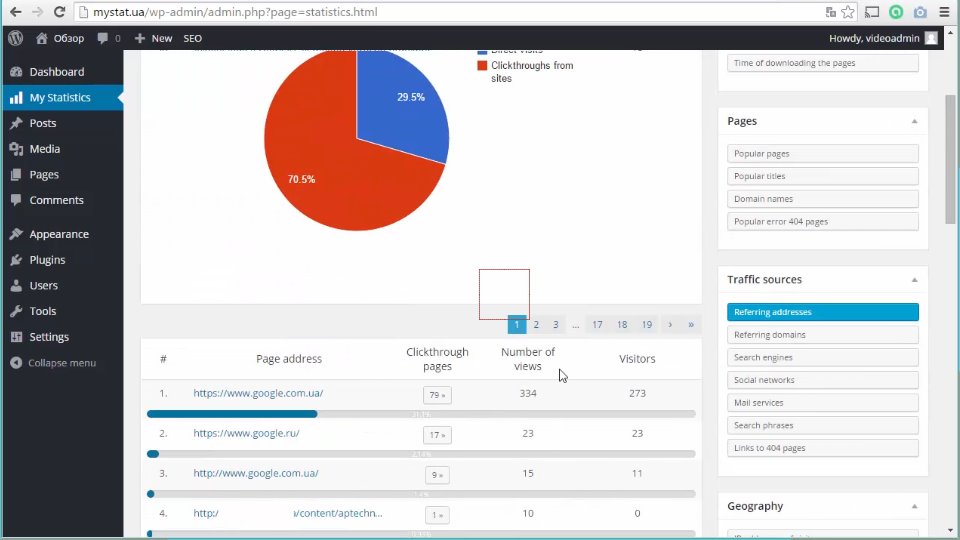
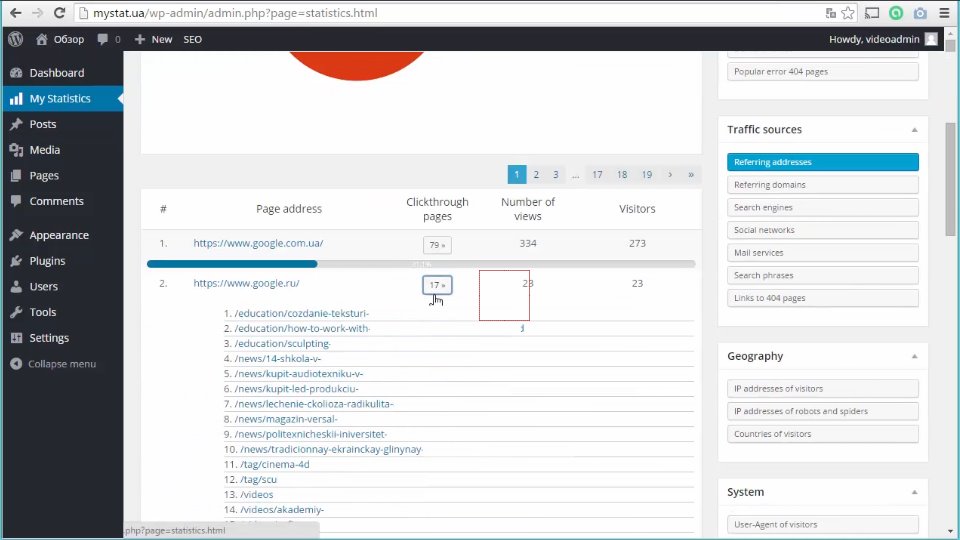
This is the section for site addresses, from which the users clicked through to your site. The exact location and addresses of direct clickthroughs and referrals. The information is displayed as convenient diagrams and as detailed lists.
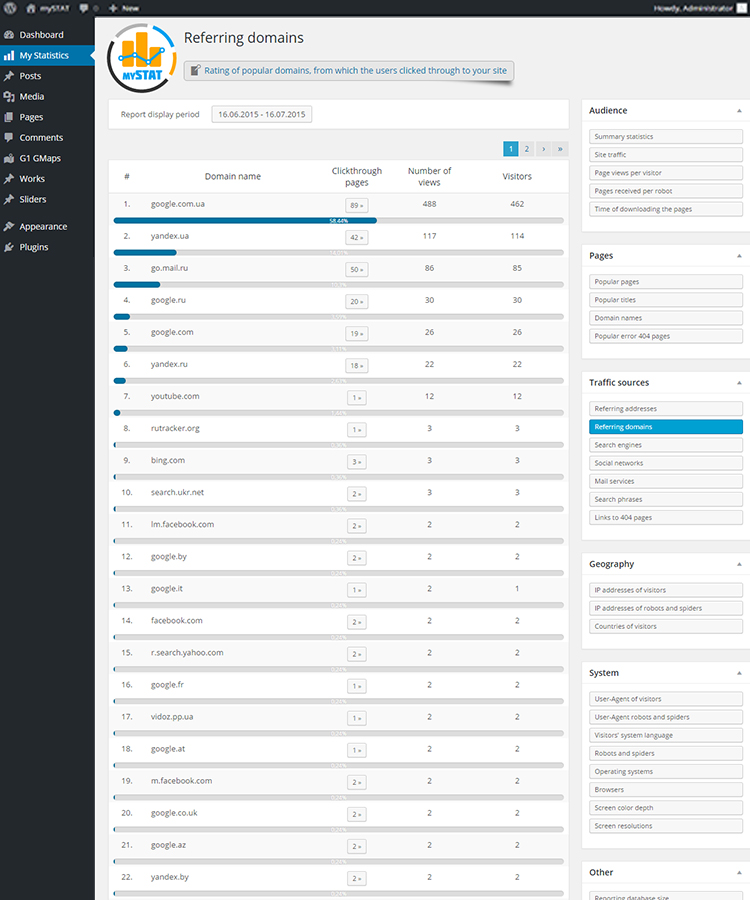
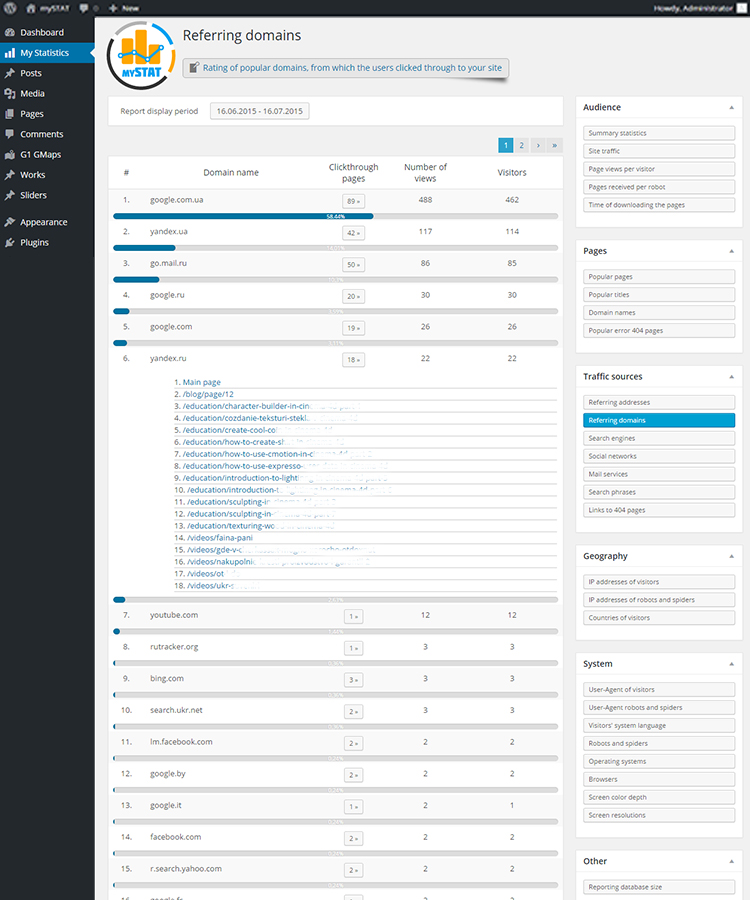
Referring domains.
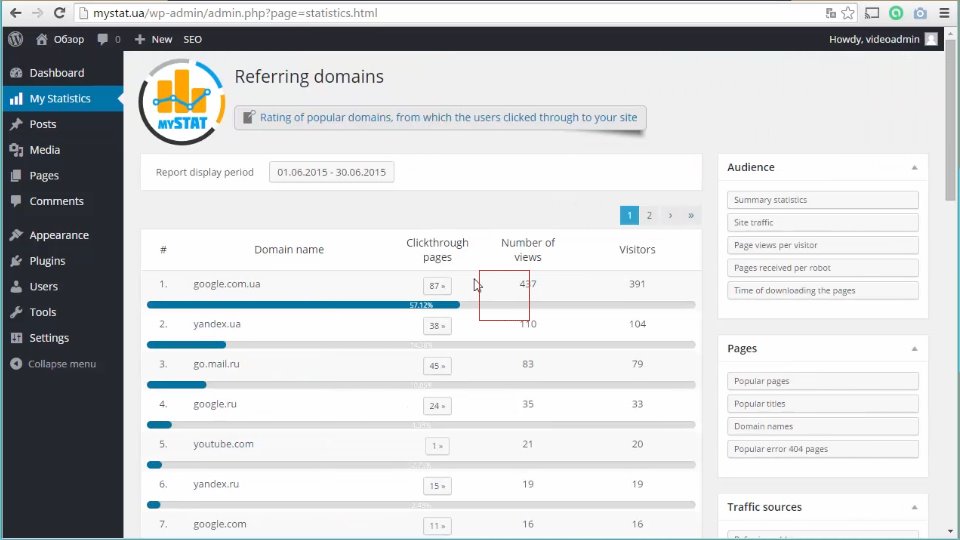
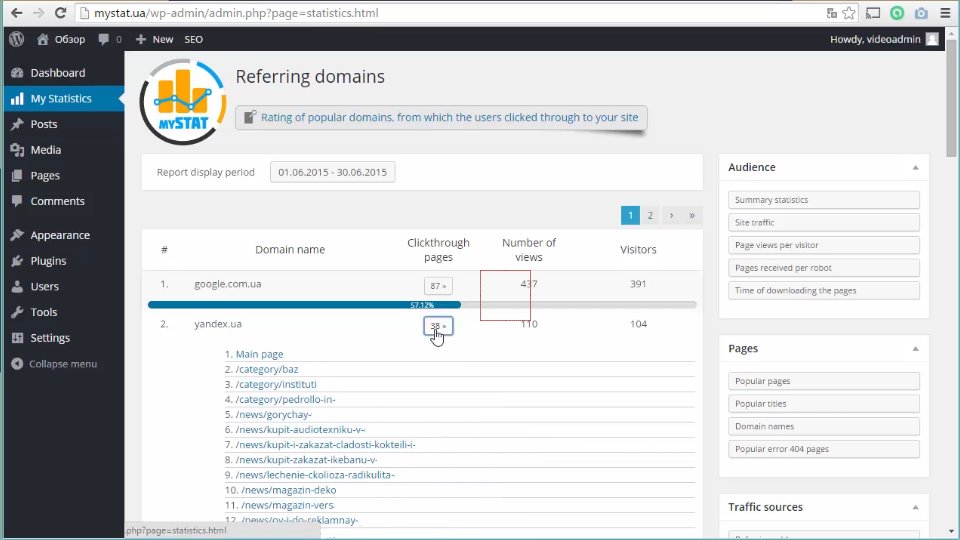
Overall rating of domains from which clickthroughs to your site occur. The information is also displayed as convenient diagrams and as detailed lists.
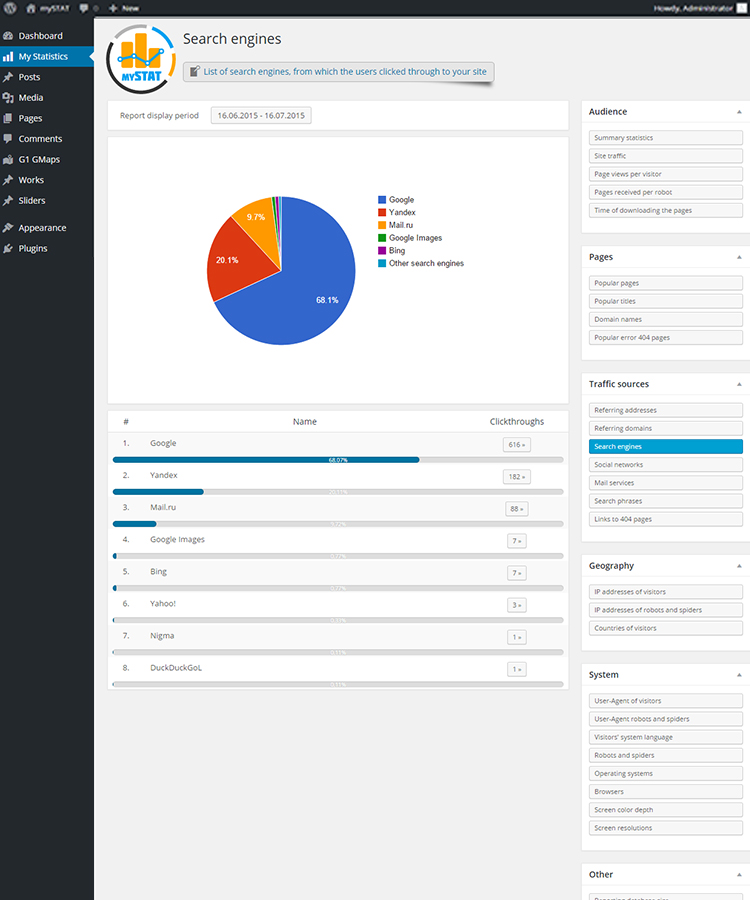
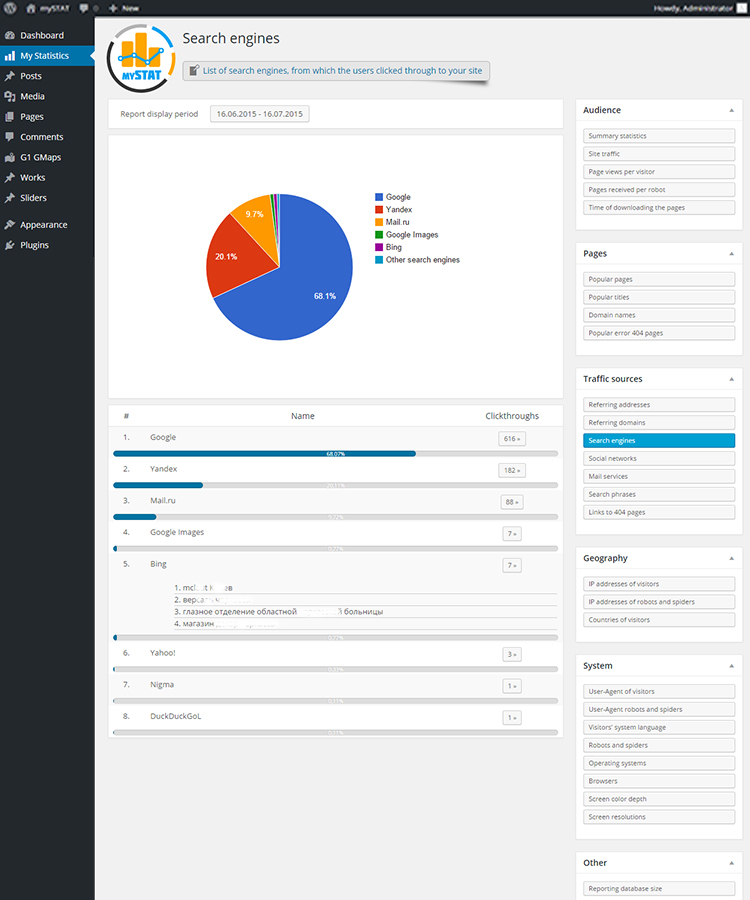
Search engines.
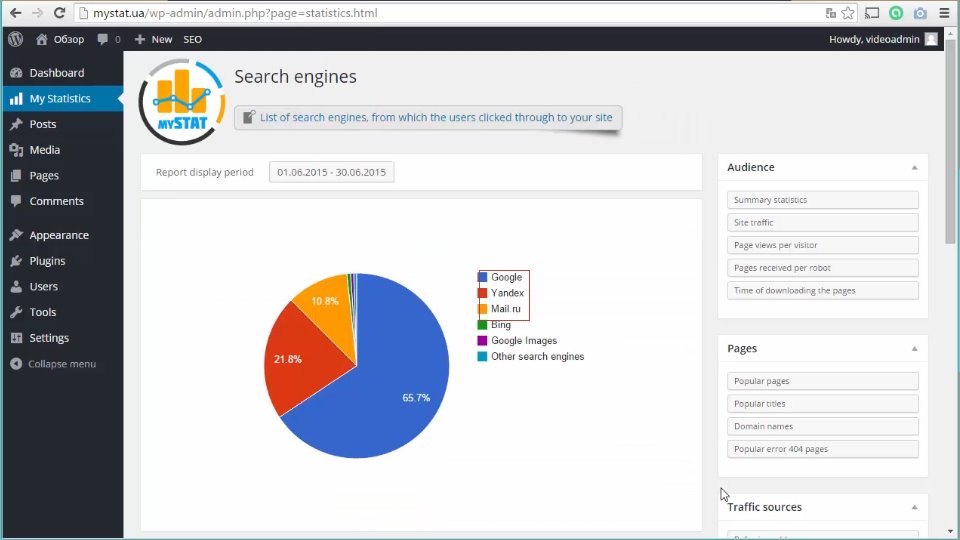
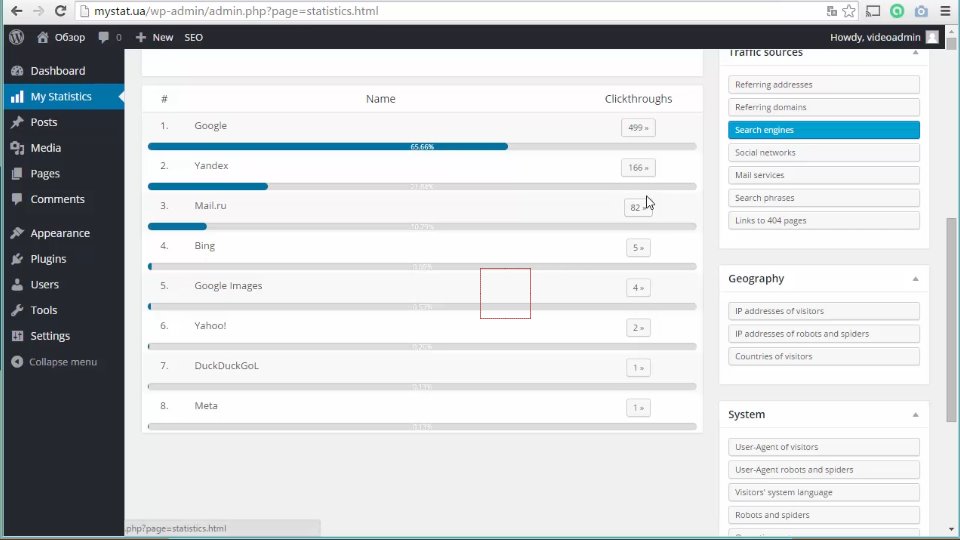
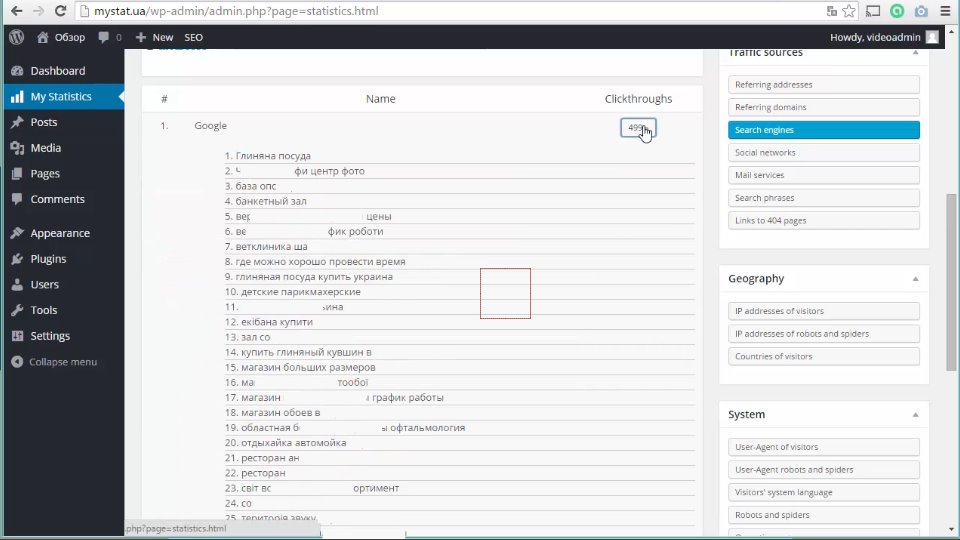
Visits to your site from search engines. You can view the information as a diagram and as a list containing the search phrases.
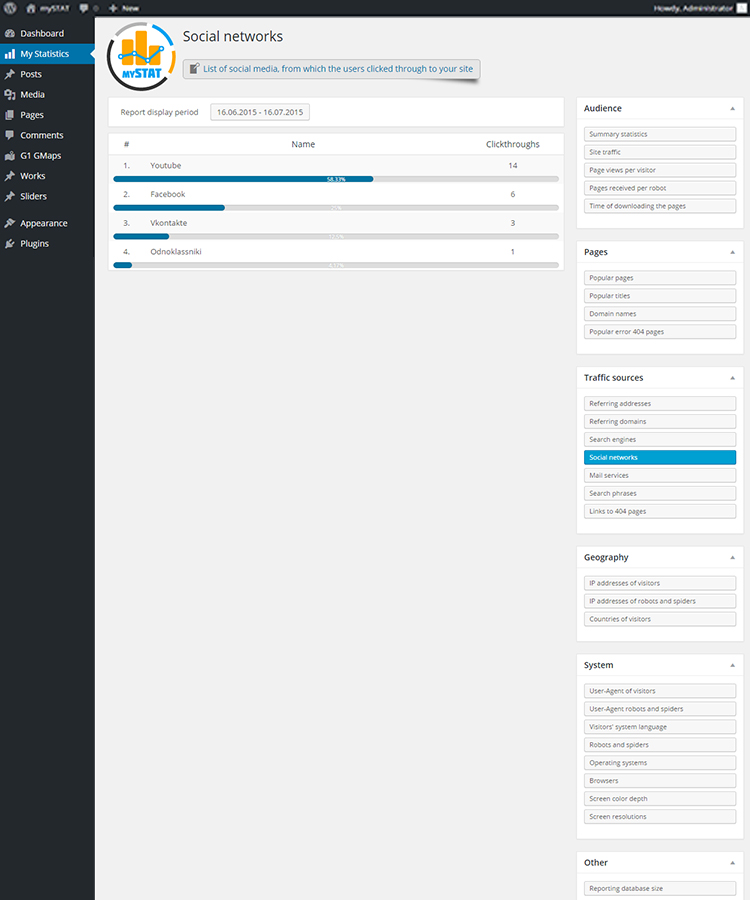
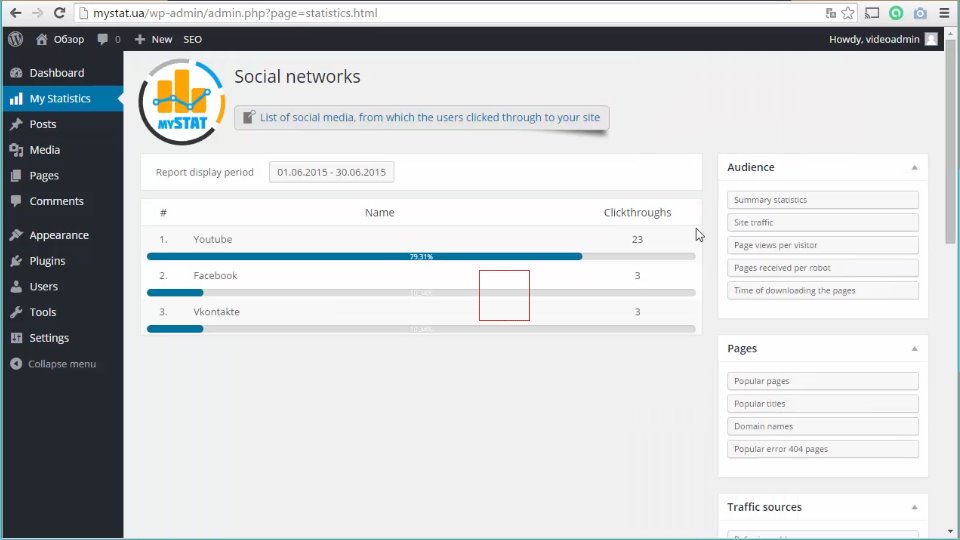
Social networks.
Here you can see the visits to your site made directly from search engines.
Mail services.
The clickthroughs from on-line search engines. Names of mail services, from which visitors clicked through to your site. It will be useful, if the current site runs mailing lists, if mailing lists use certain mail services, and this information will help to evaluate the efficiency of mailing list with various mail services.
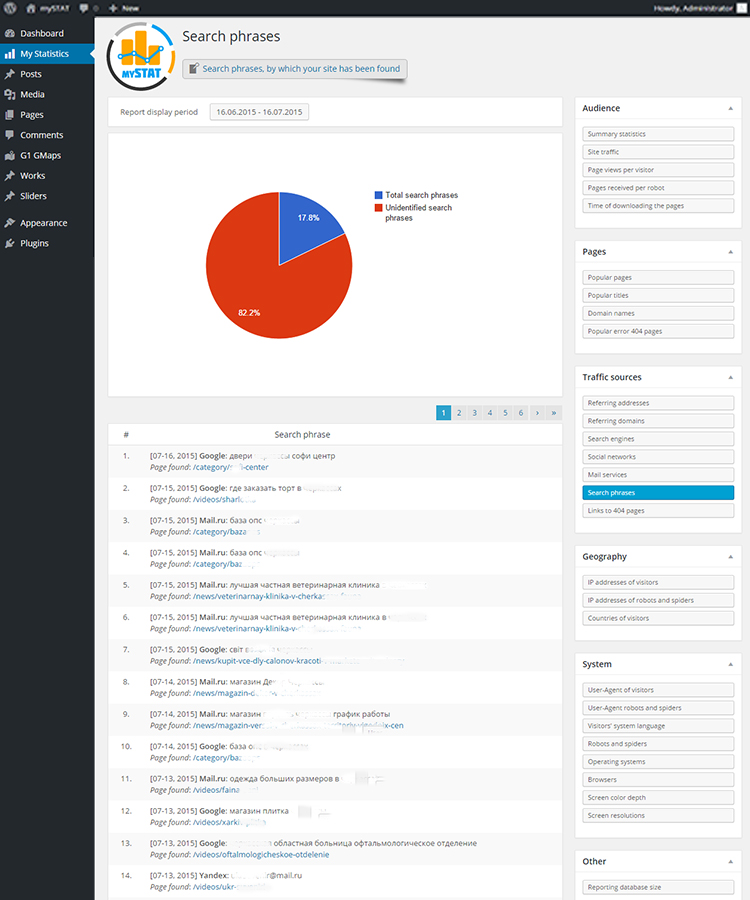
Search phrases.
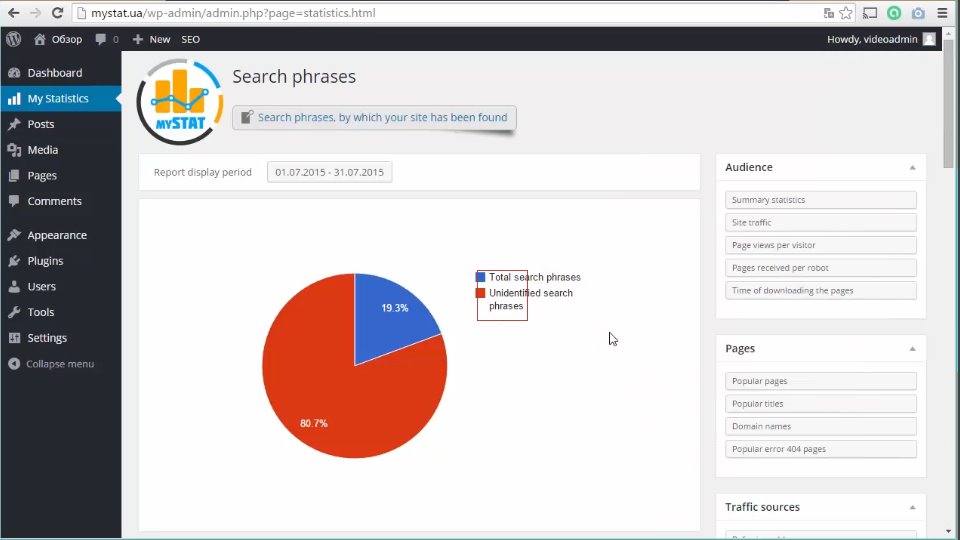
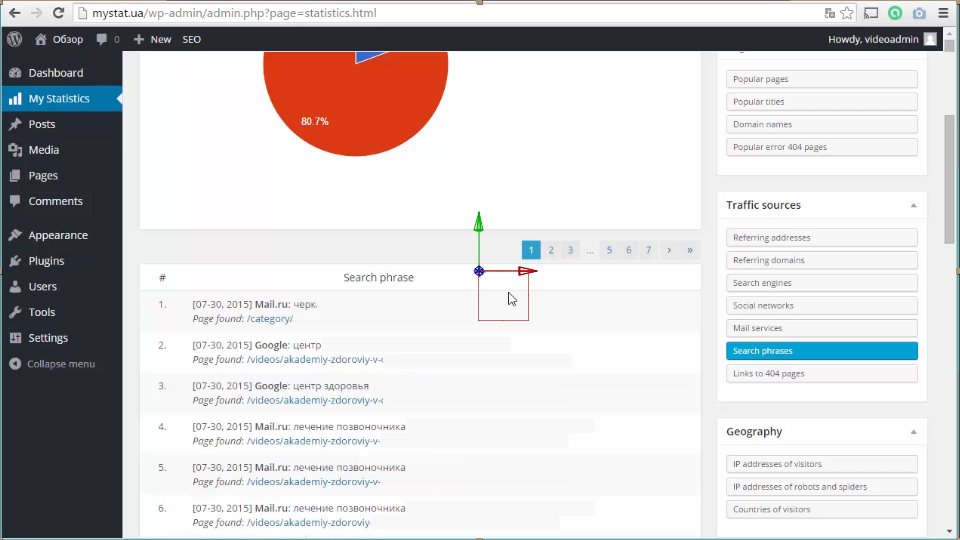
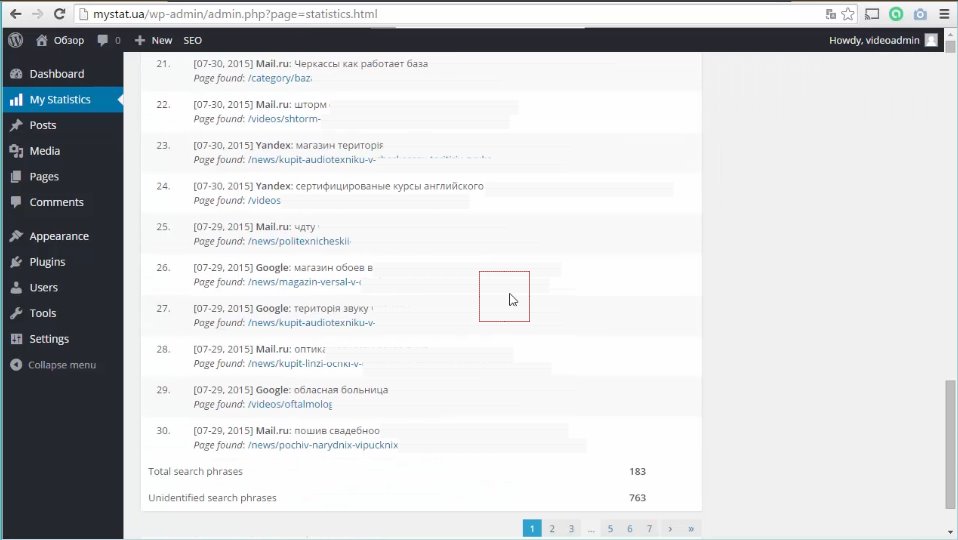
This is a very functional and important section. It deals with phrases and word-combinations, using which the visitors found your site via search engines. It would greatly help SEO optimizers, bloggers, authors. At the moment, many search engines conceal this information so it is impossible to determine absolutely all the phrases, but MyStat determines the maximum possible number of words and phrases.
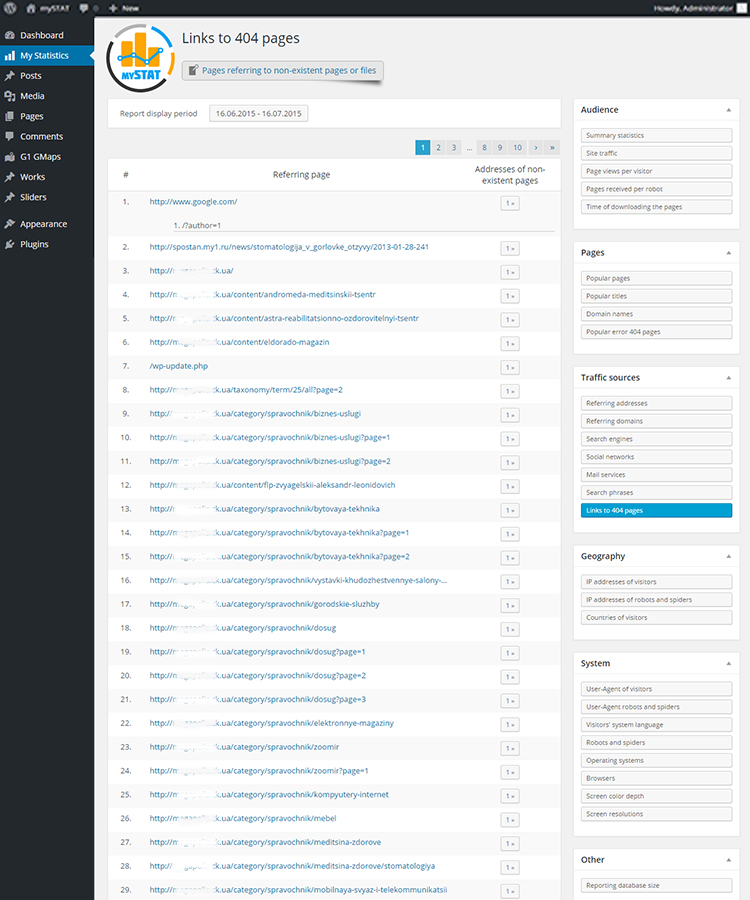
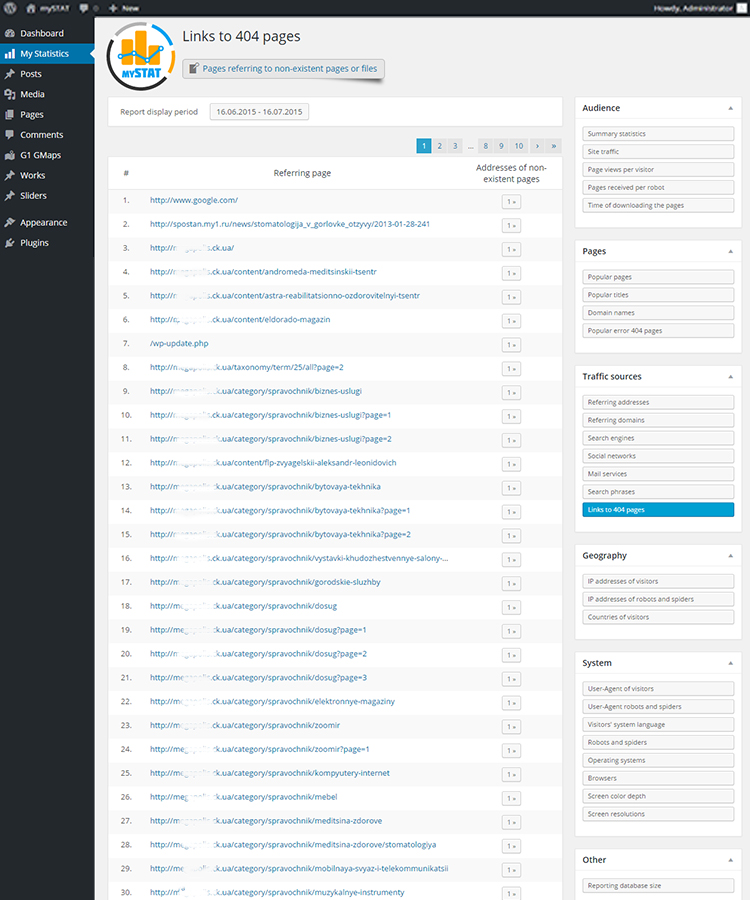
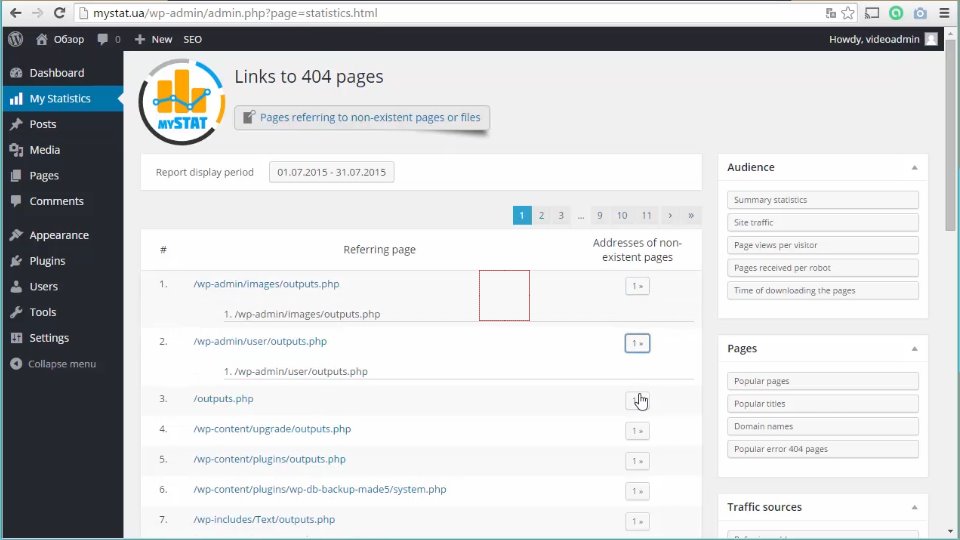
Links to 404 pages.
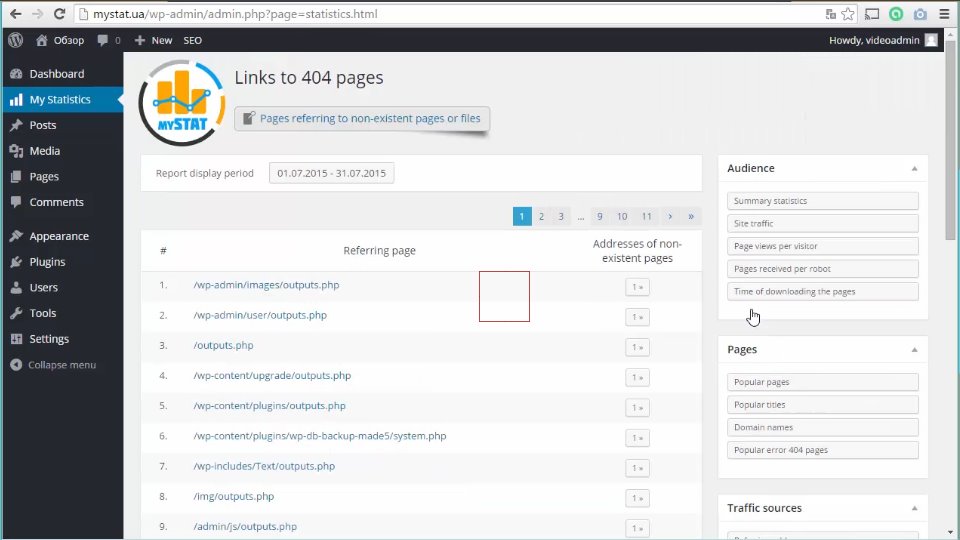
This is a good section that lists the URLs from which the transitions to non-existent pages of your site were made. It allows you to analyze the available information in detail and take appropriate action.
Section: Geography.
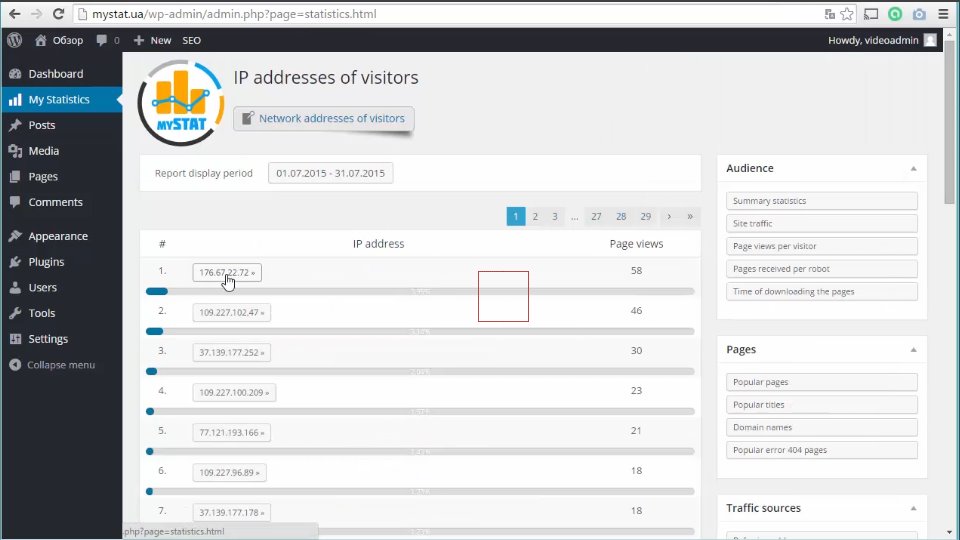
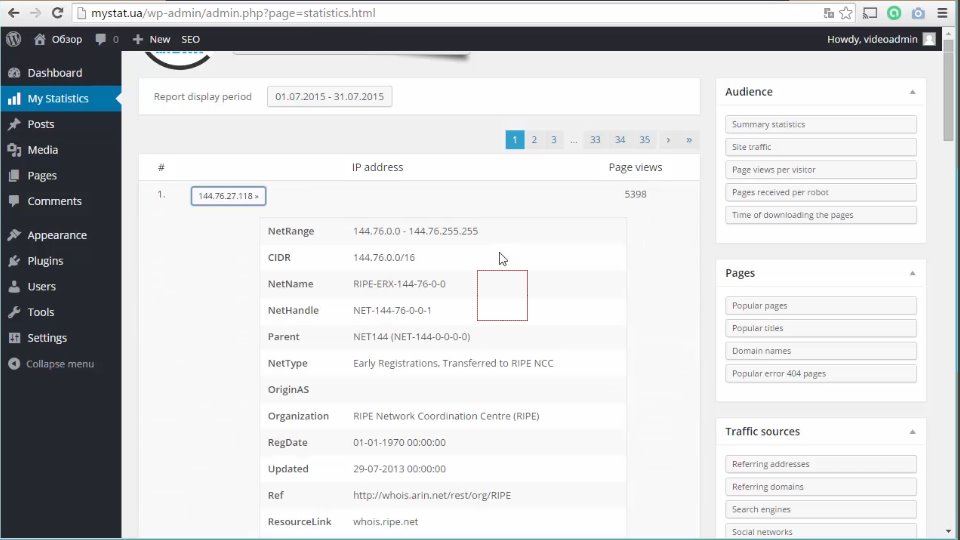
IP addresses of visitors.
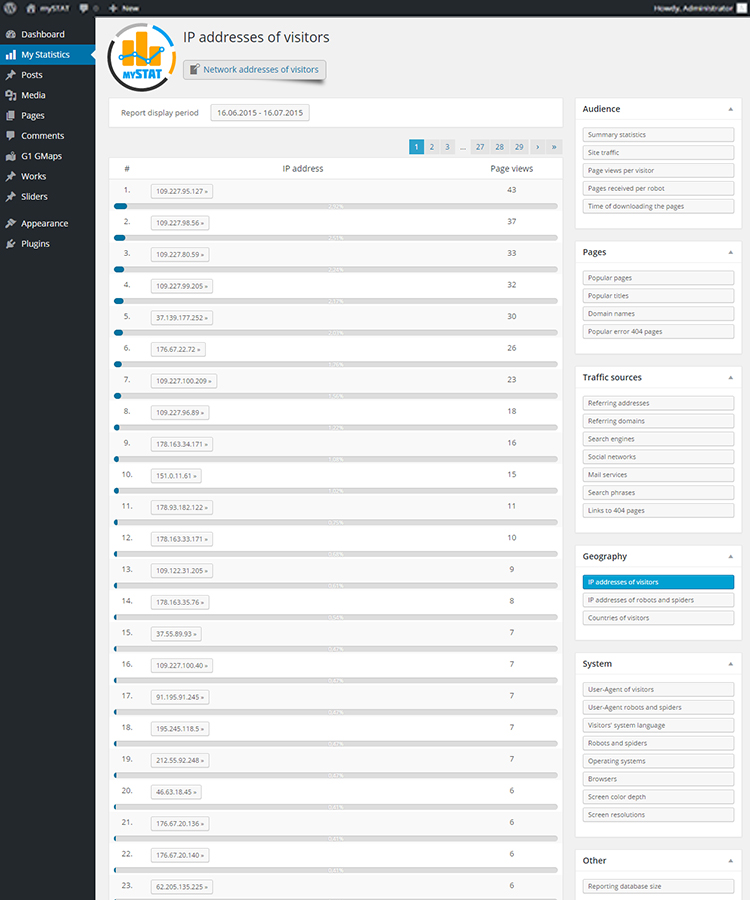
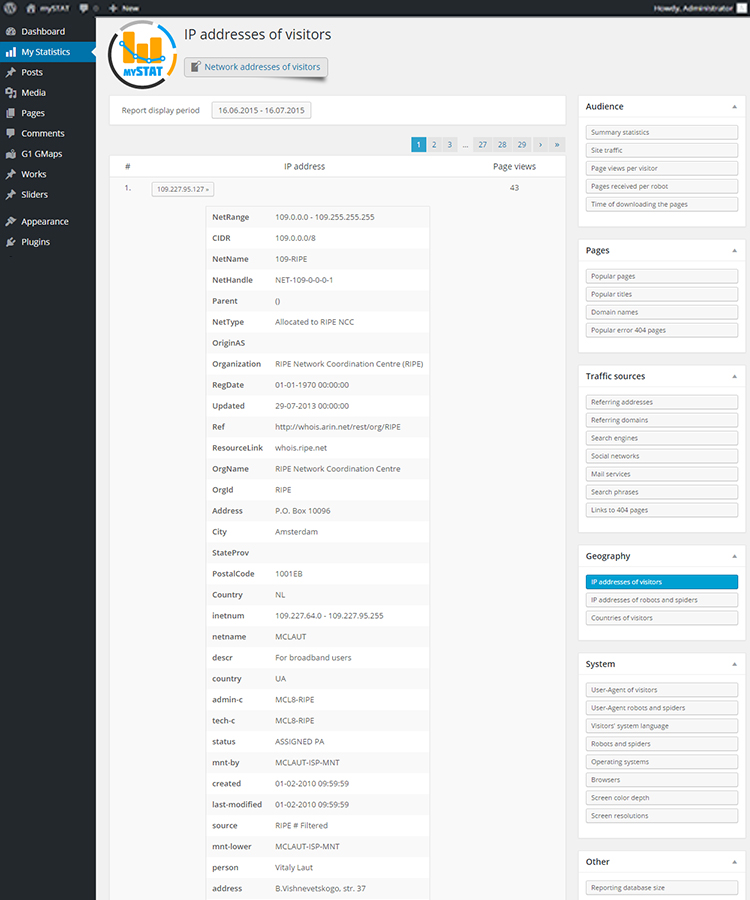
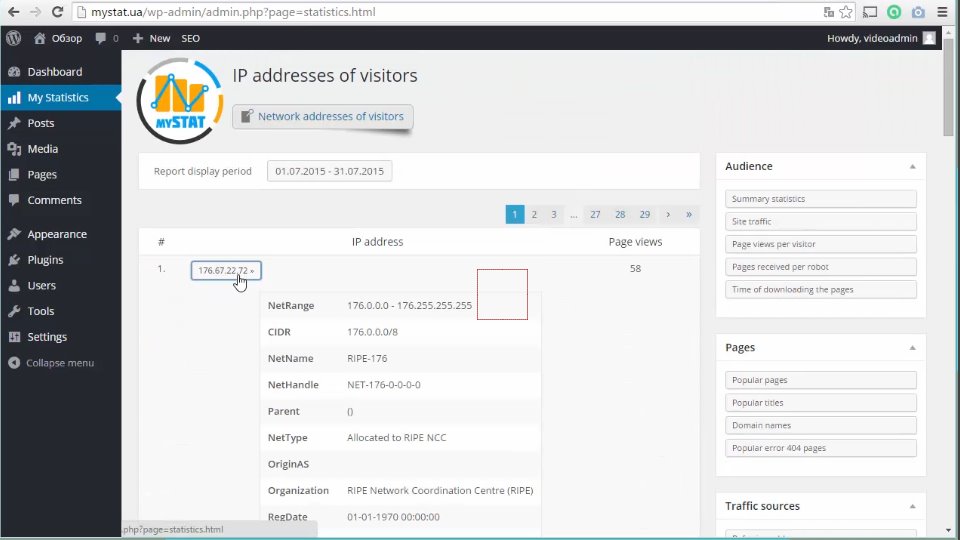
A detailed list of users network addresses. Clicking on any address it is possible to see all the available information on the given network address. All the available info looks like this.
IP addresses of robots and spiders.
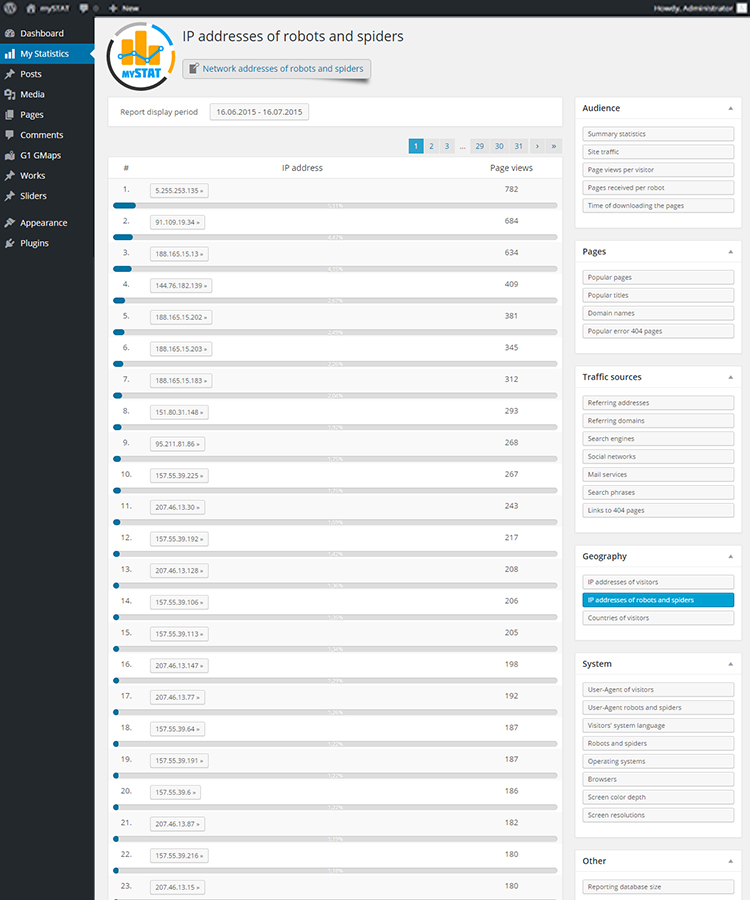
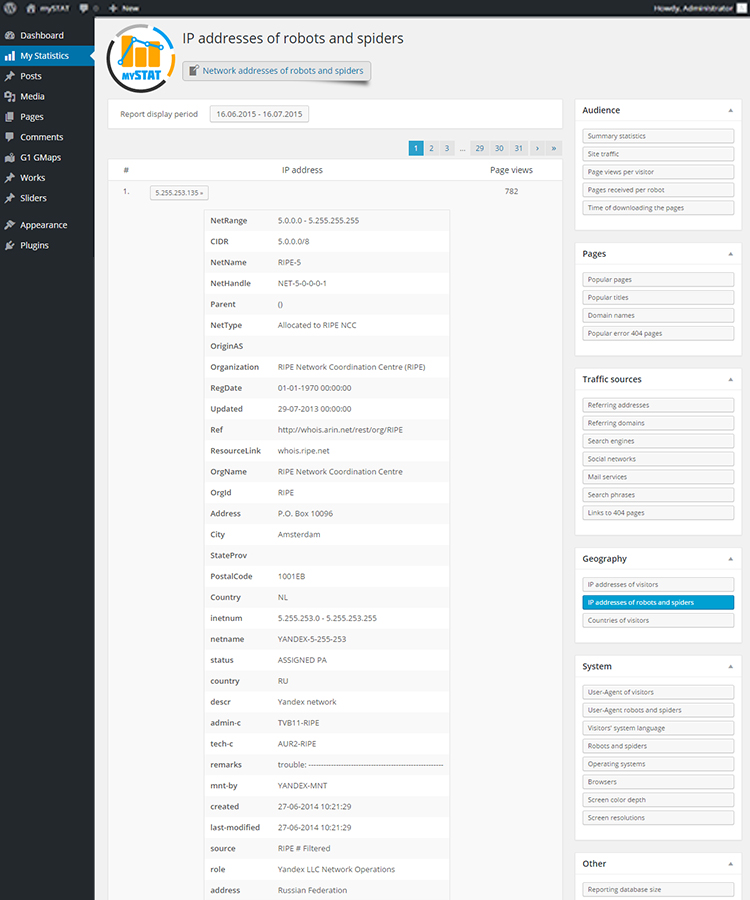
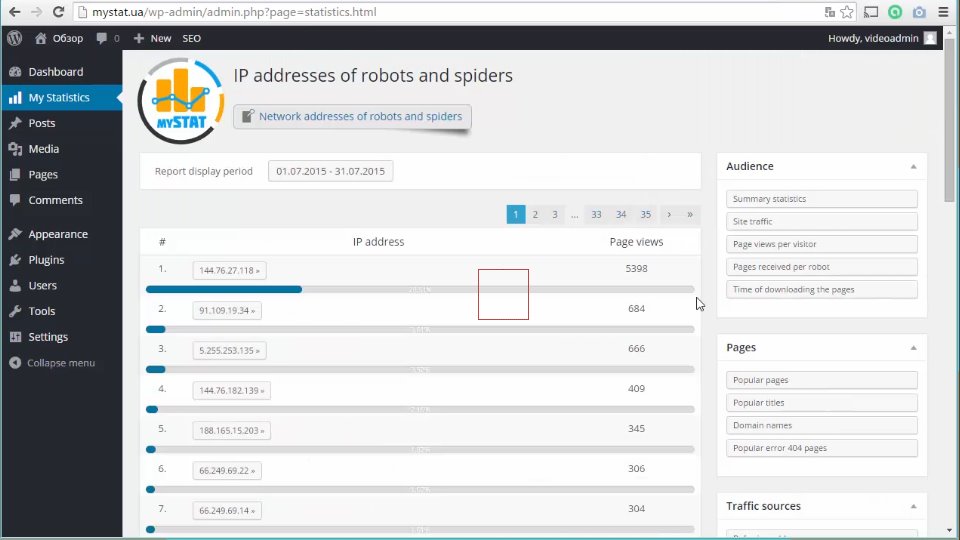
Robots and spiders will not escape us either. A detailed list of robots and spiders network addresses. Just like in the previous section, here you can find all the details available for each particular address.
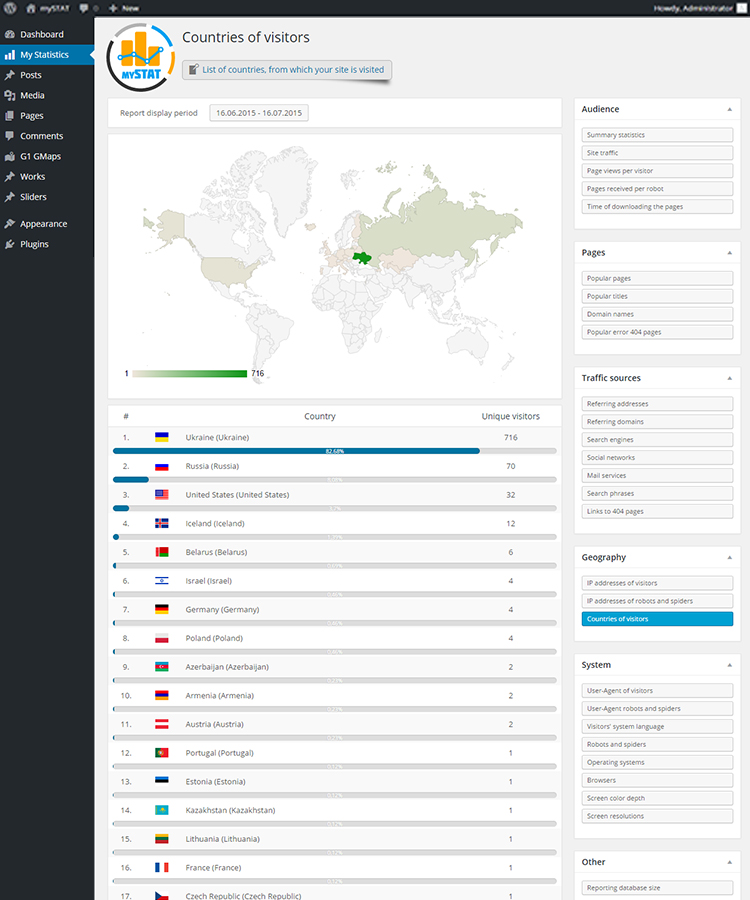
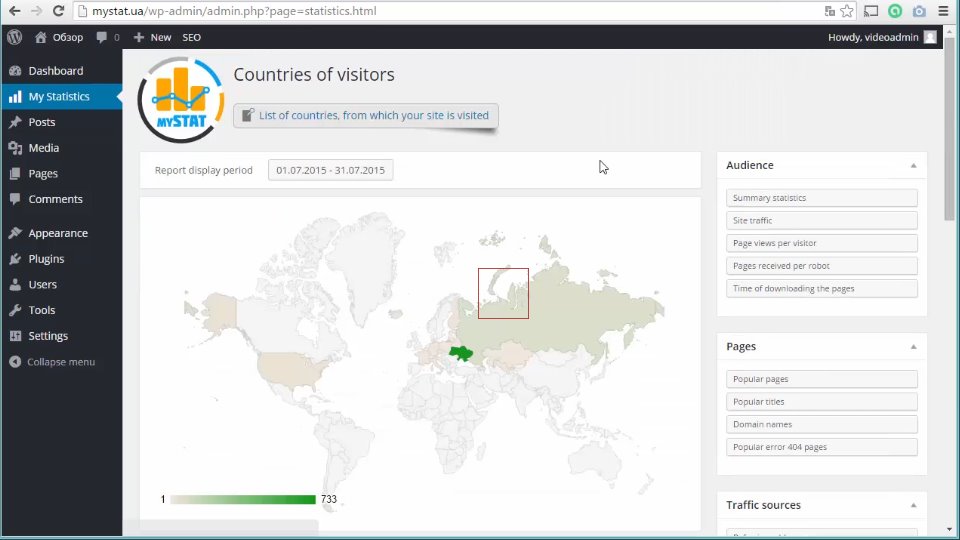
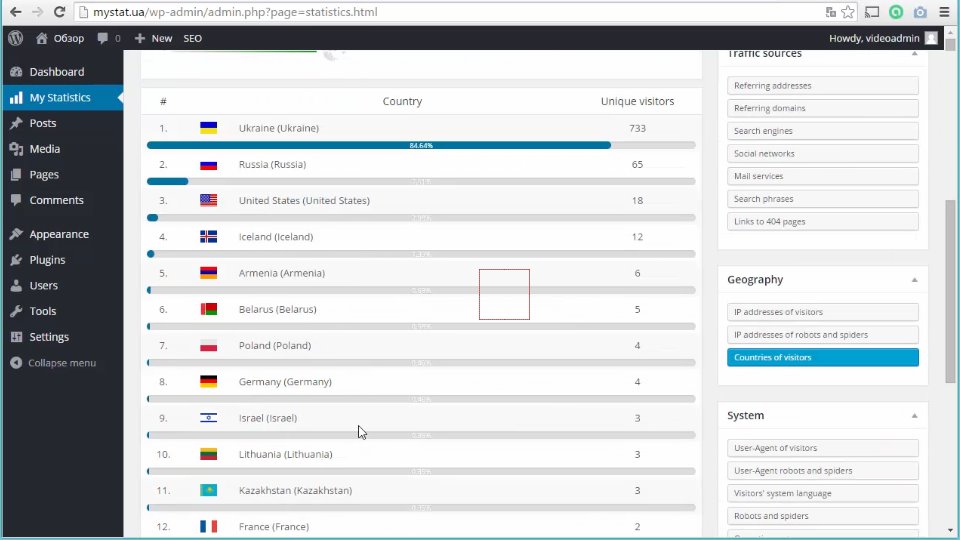
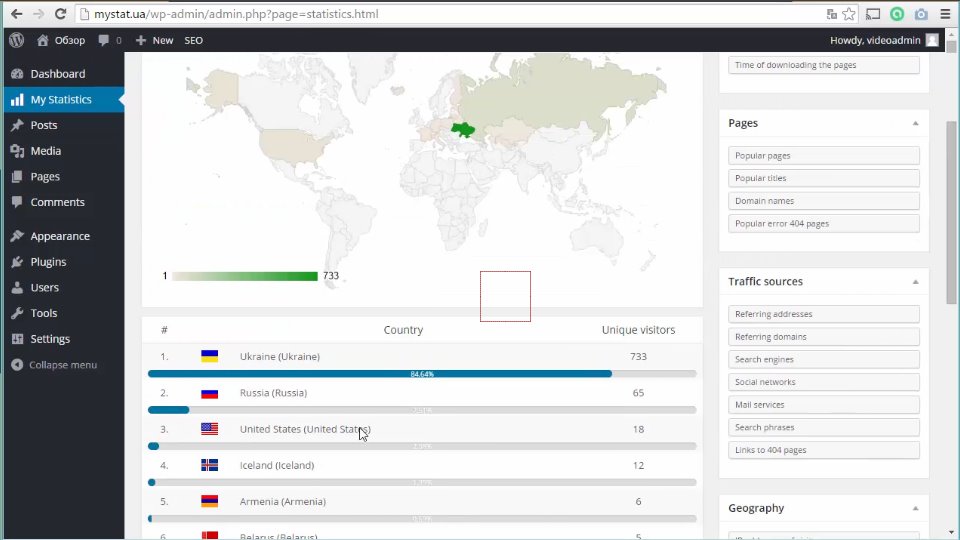
Countries of visitors.
List of countries, from which your site was visited. Sorting or rating goes from the largest number to the smallest. The data are displayed as a graphic map, as well as this kind of a nice-looking list.
Section: System.
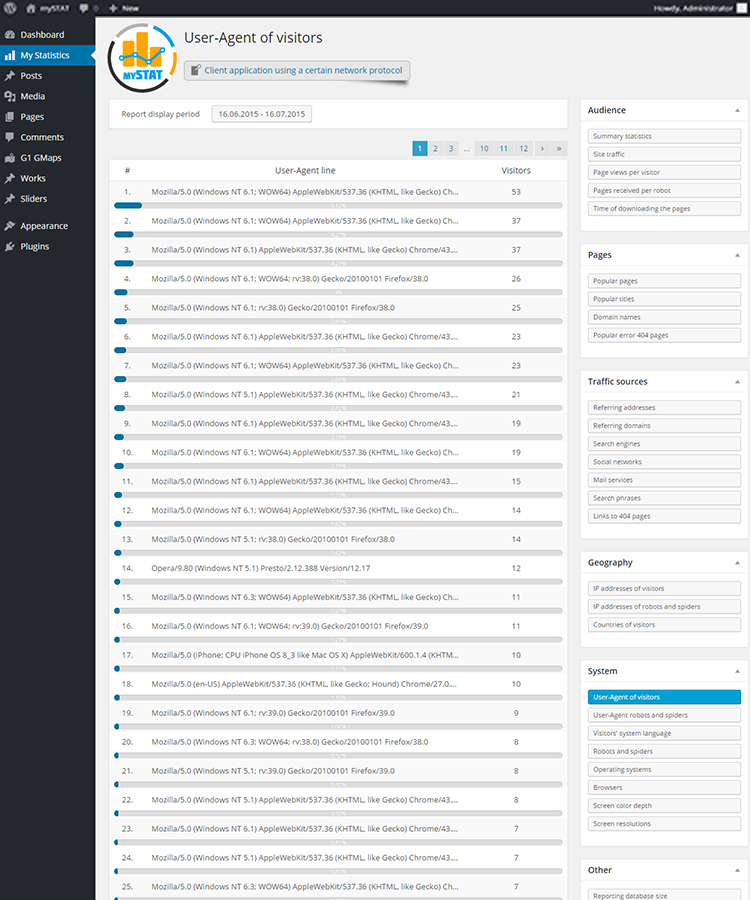
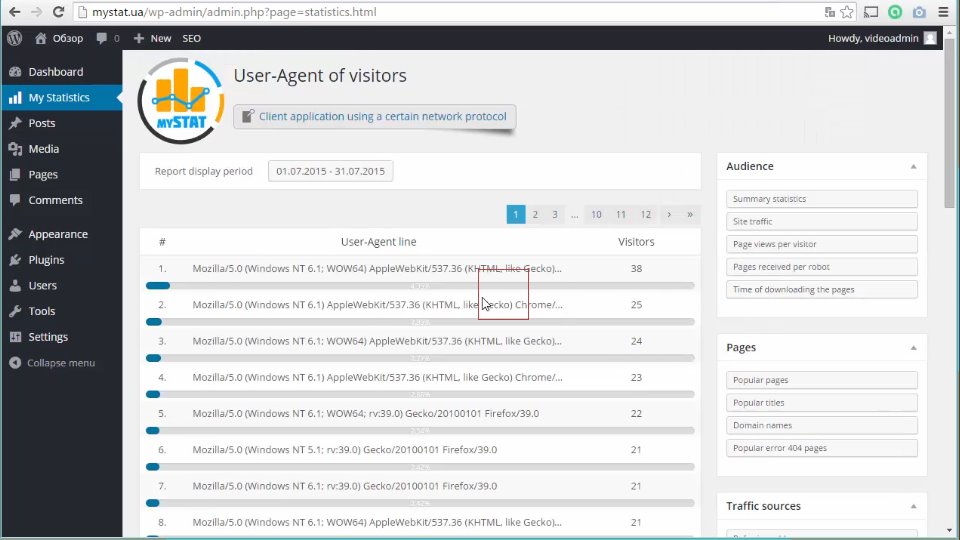
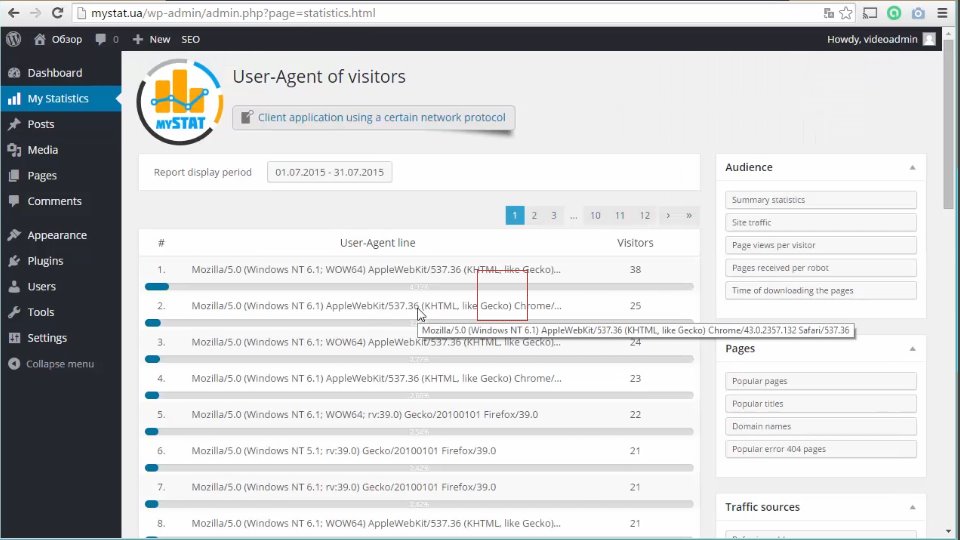
User-Agent of visitors.
The next section is related to agents or user-agents and holds complete information on the identifier of the browser used by the user to visit the site. This information will be of use for developers, as it is mostly technical, yet comprehensive. All the information is highlighted by hovering the cursor over it.
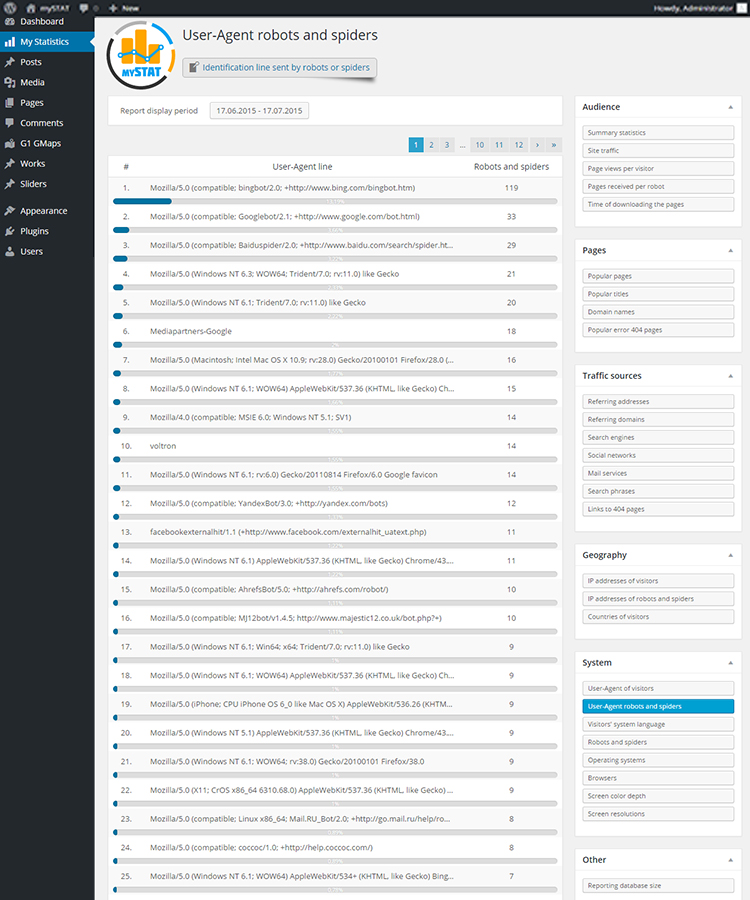
25. User-Agent robots and spiders.
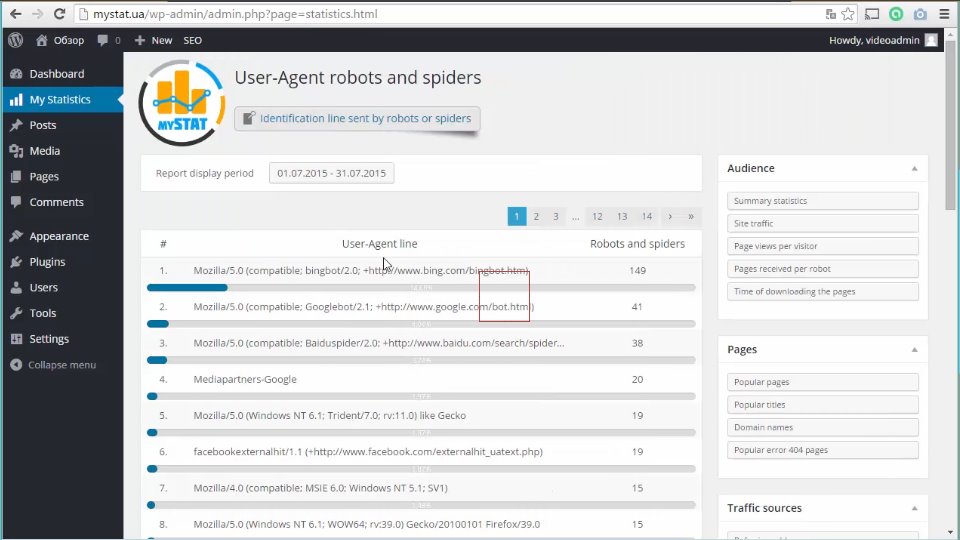
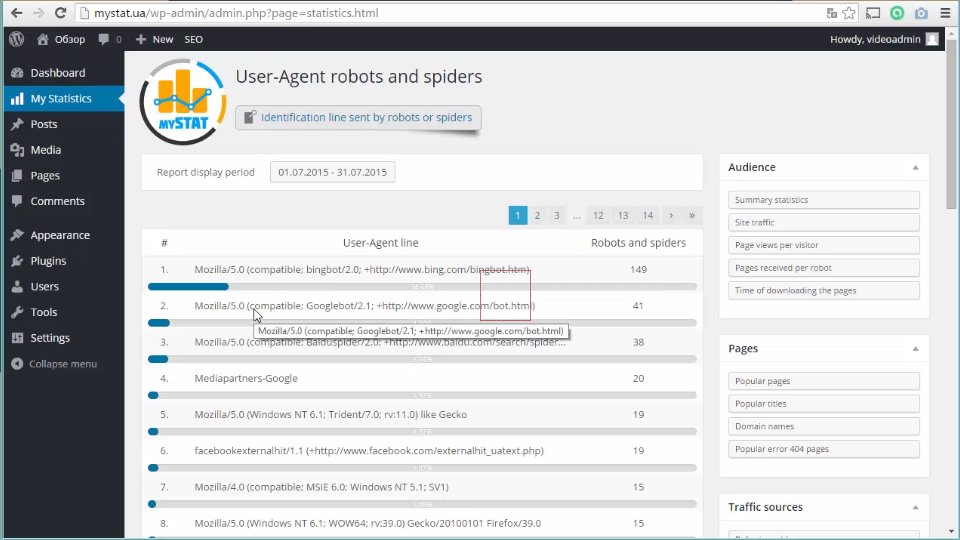
The next section is also related to agents or user-agents and holds complete information on the identifier of the browser used to visit the site specifically by a robot. This information will also be of more use for developers, as it is mostly technical.
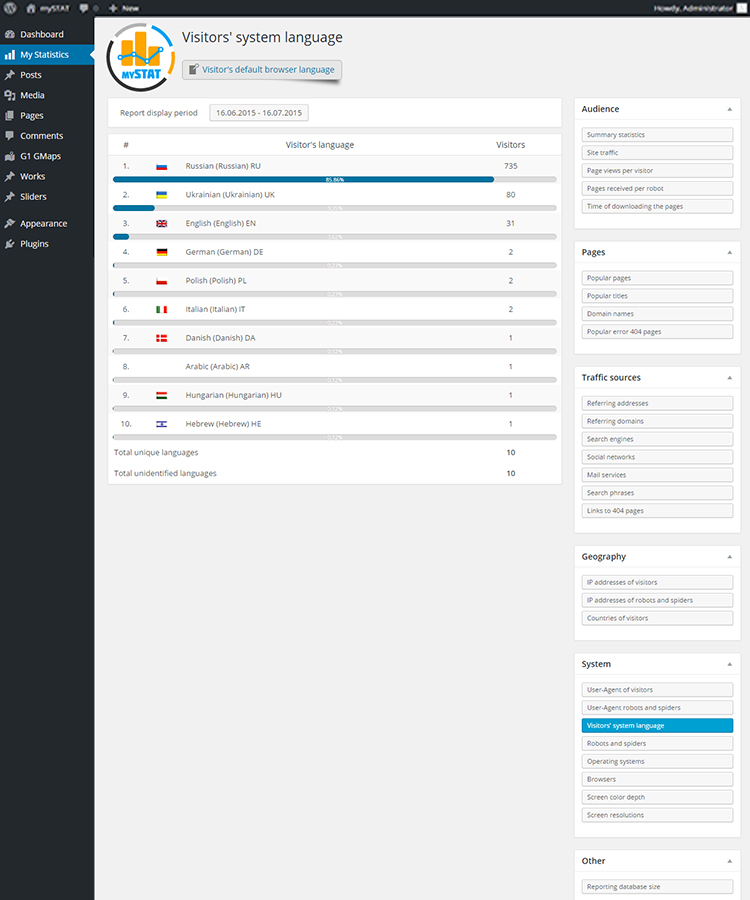
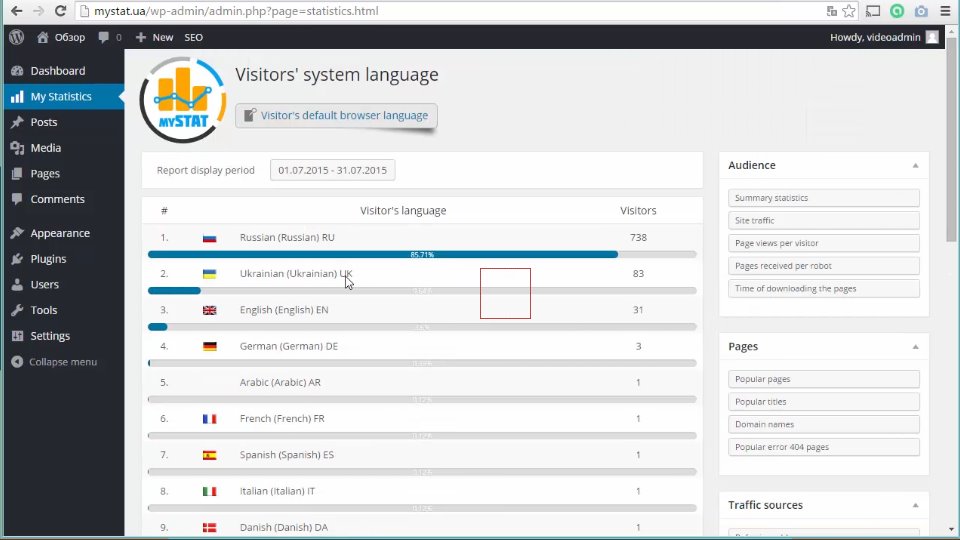
Visitors’ system language.
The next section refers to the user’s preferred language set up in the browser. The data is presented here as a list of the following kind.
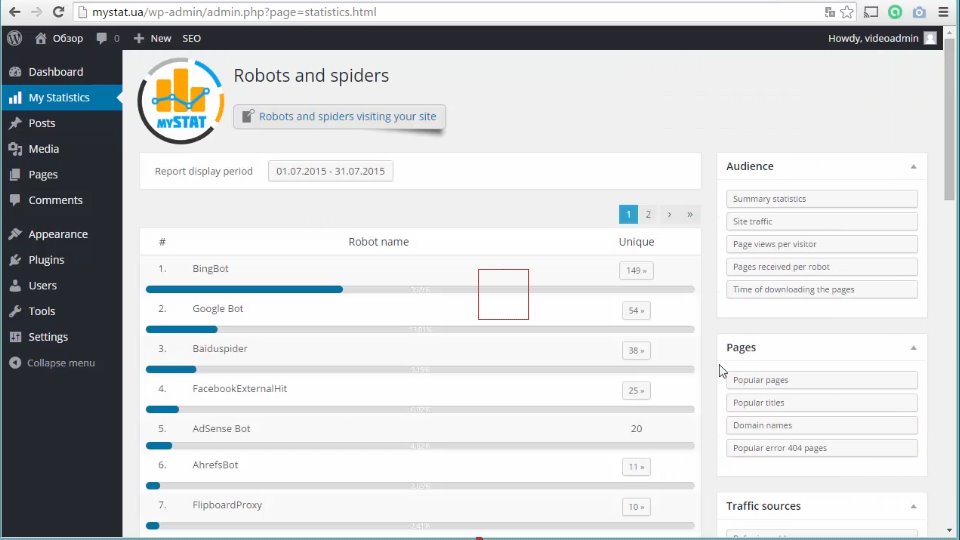
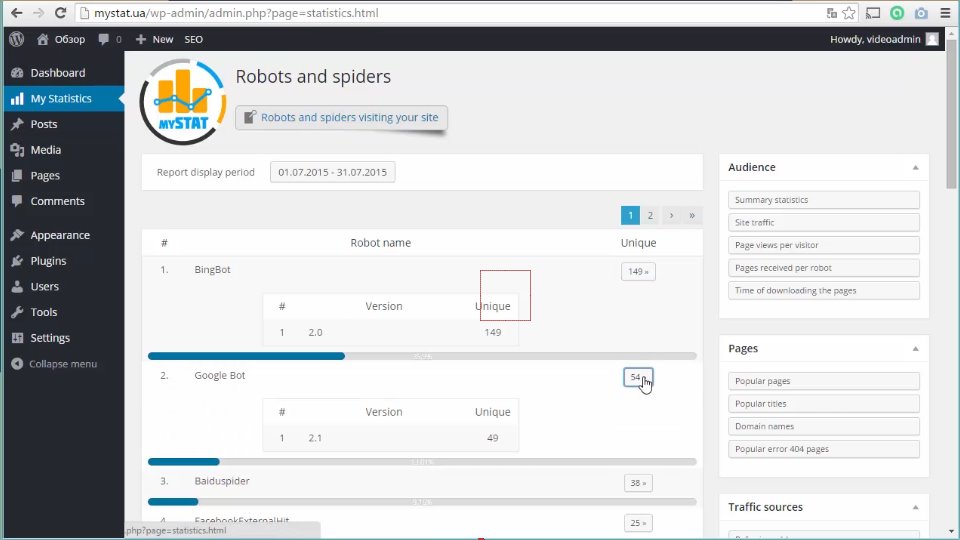
Robots and spiders.
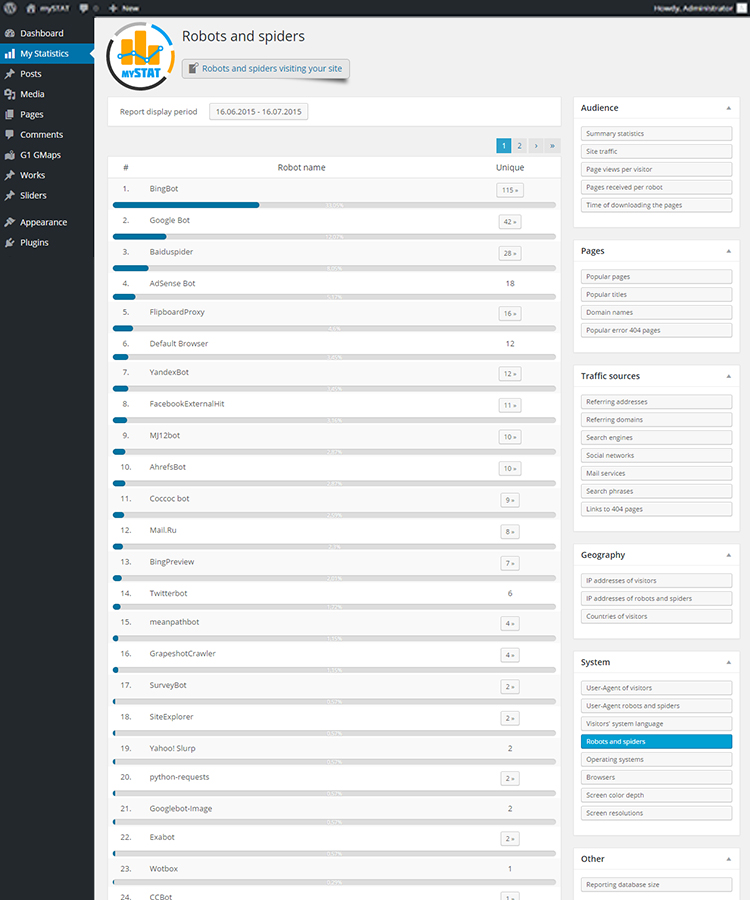
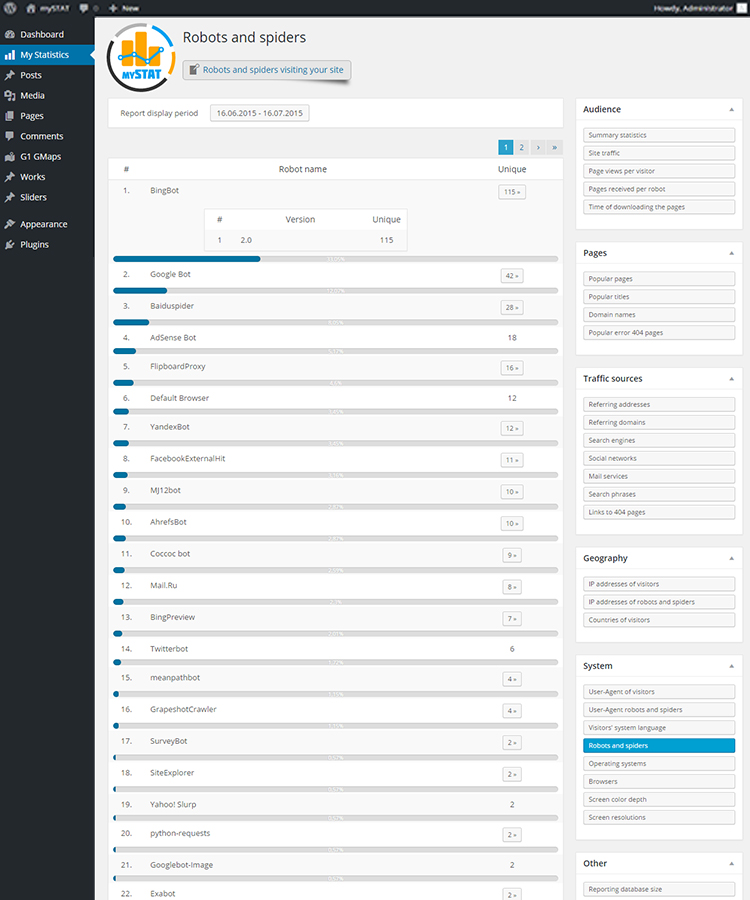
A very interesting section which provides information on the robots and spiders regarding their version and unique visit of a particular robot to your site. This is how you can view the robot details.
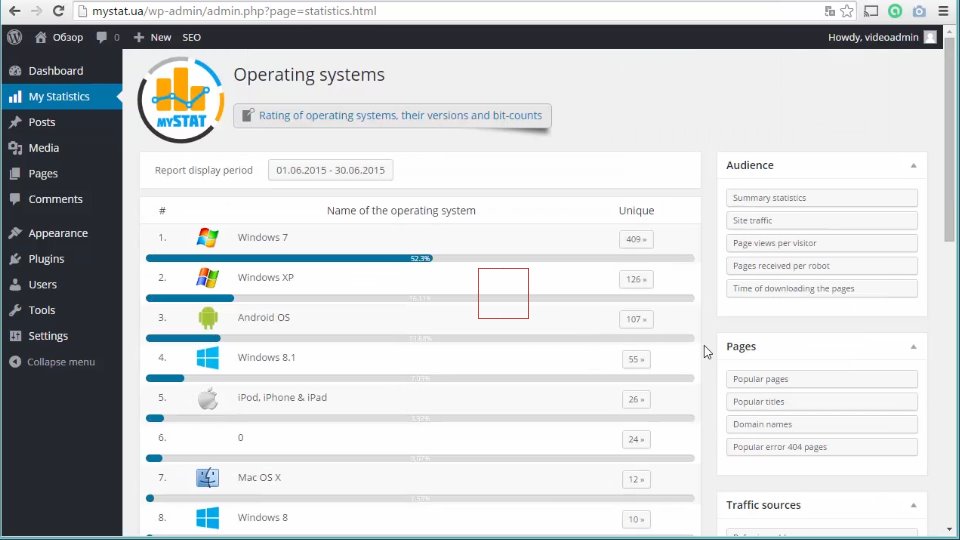
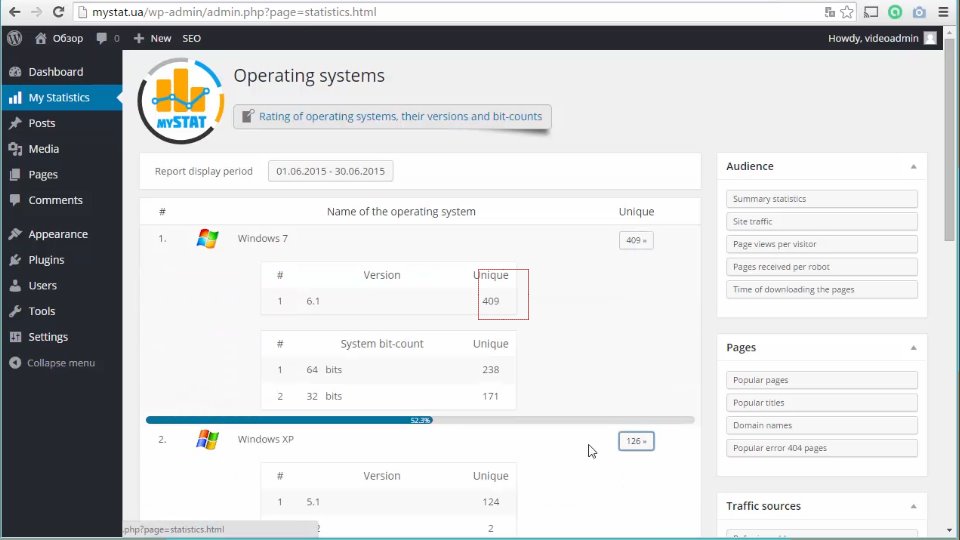
Operating system.
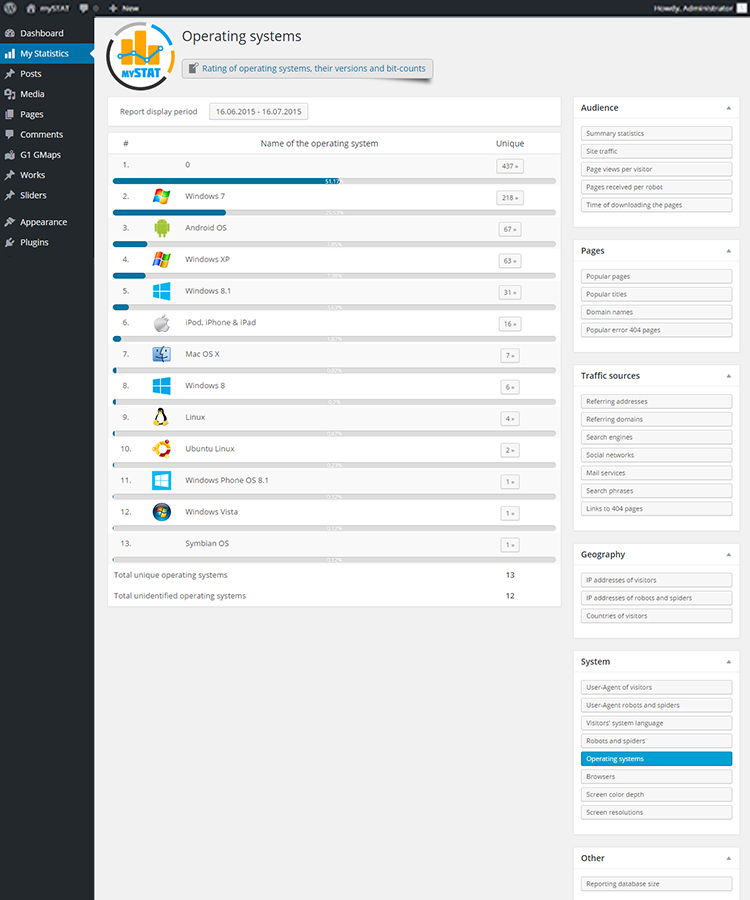
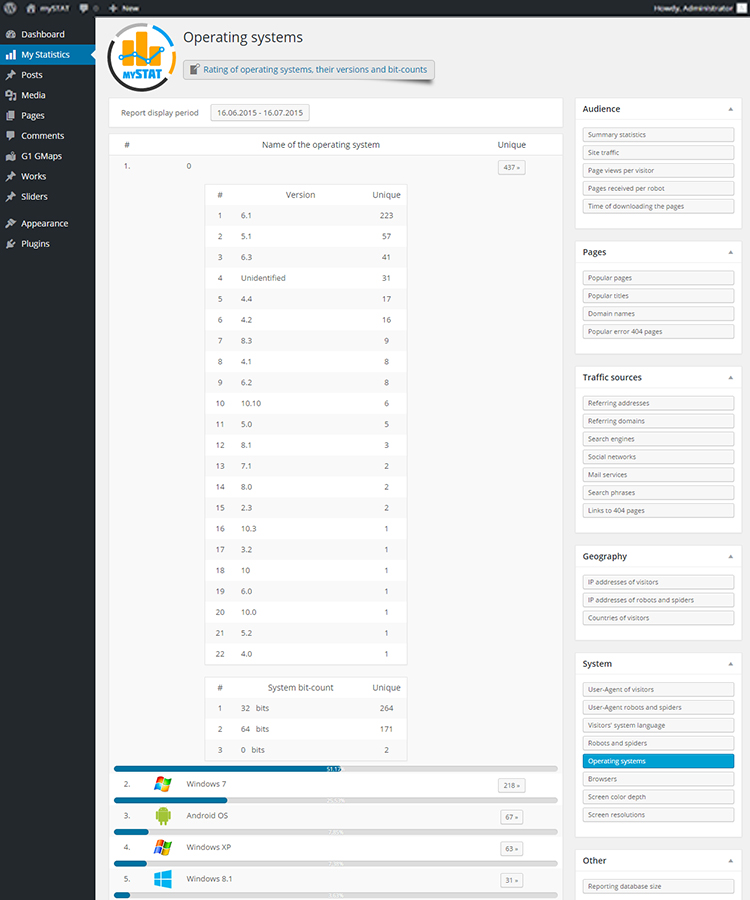
The next section deals with the visitor’s installed operating system. Detailed information includes the version and bit-count of the system. The data are presented as a list with icons.
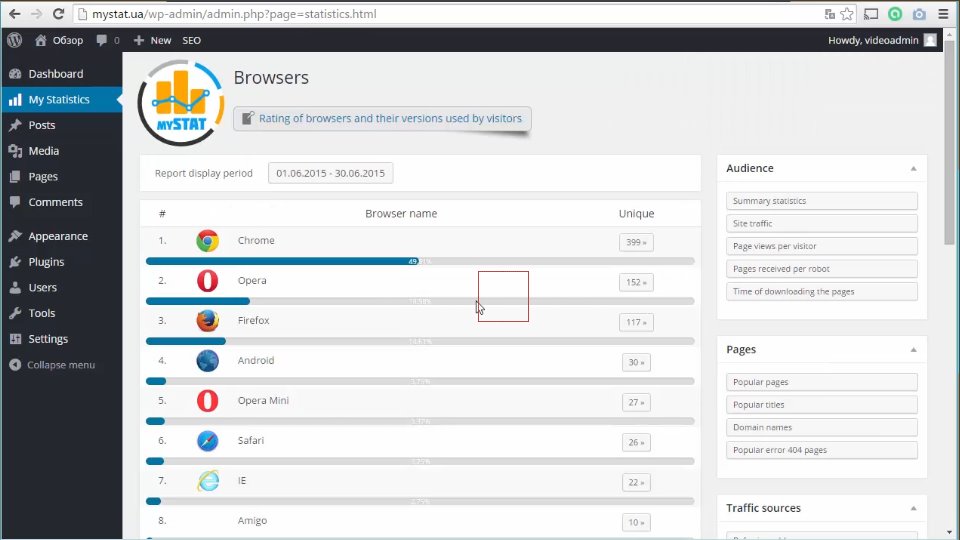
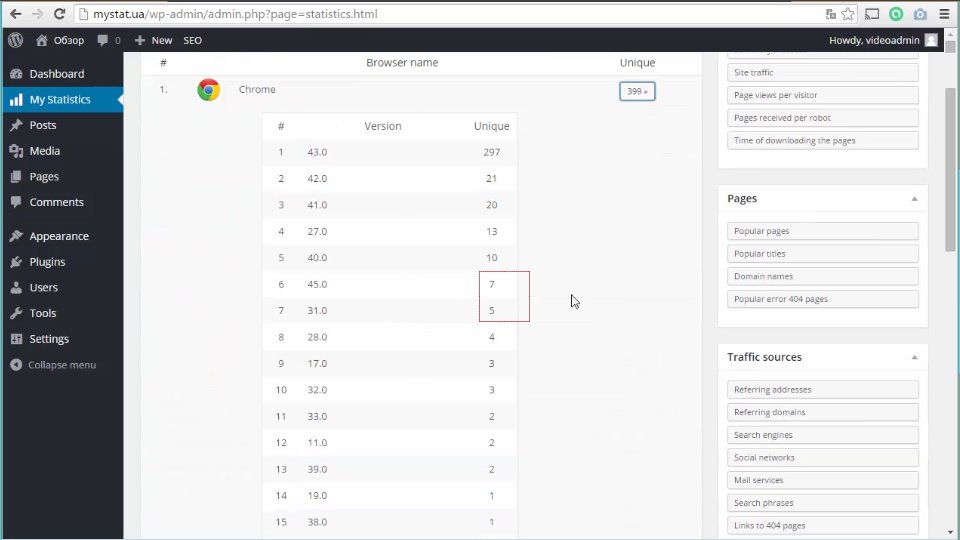
Browsers.
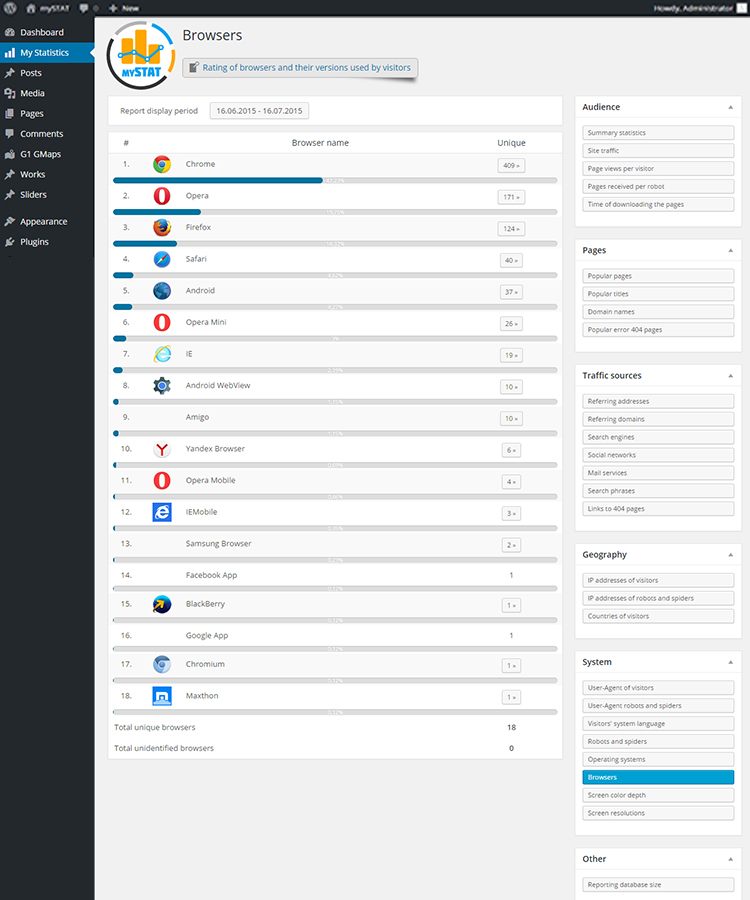
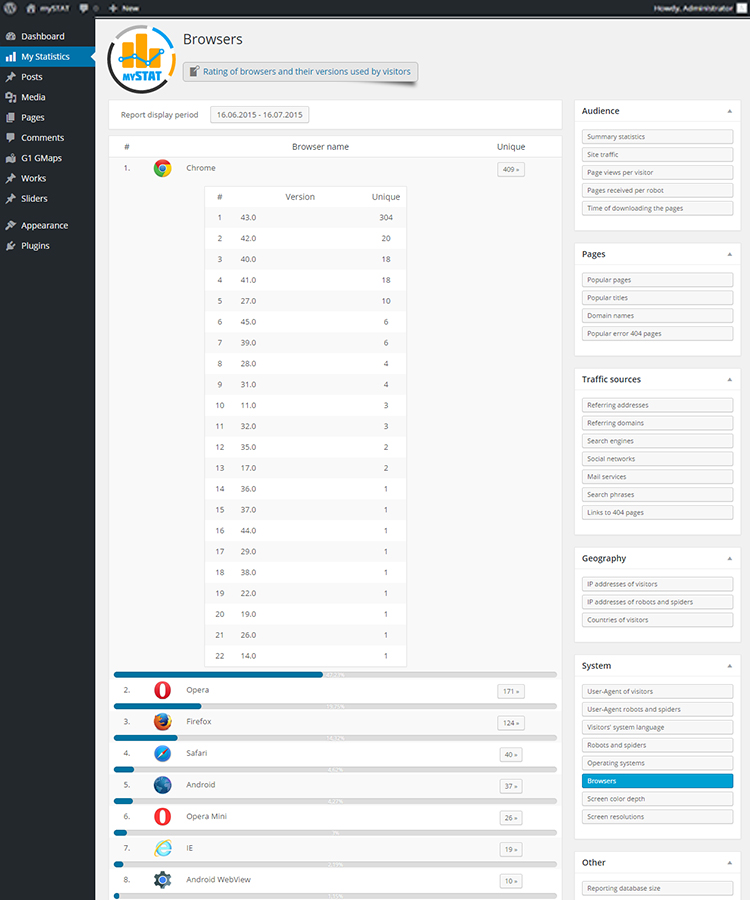
Here you can see the browsers, with the help of which users come to your site. Details show browser versions and their ranking – from highest to lowest. The data also appear as a list, and each browser is represented with its own icon.
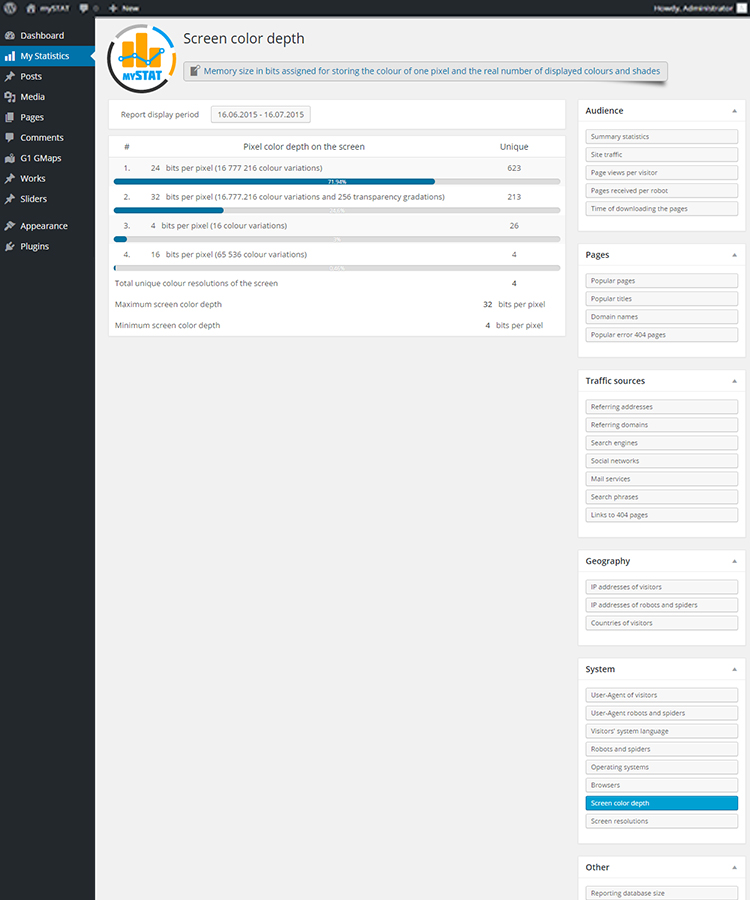
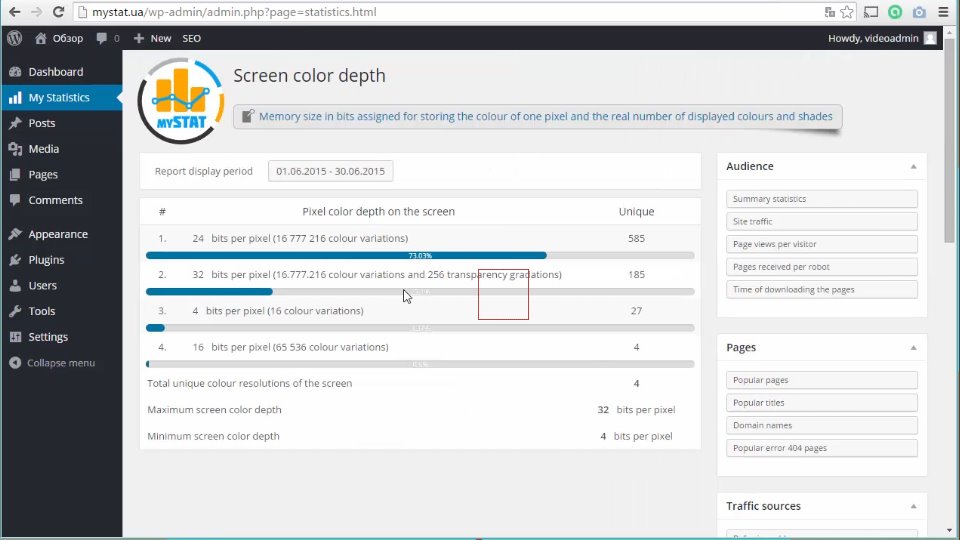
Color Depth.
This information will help the designers, as it allows to find out how many colors and shades the client screen can display.
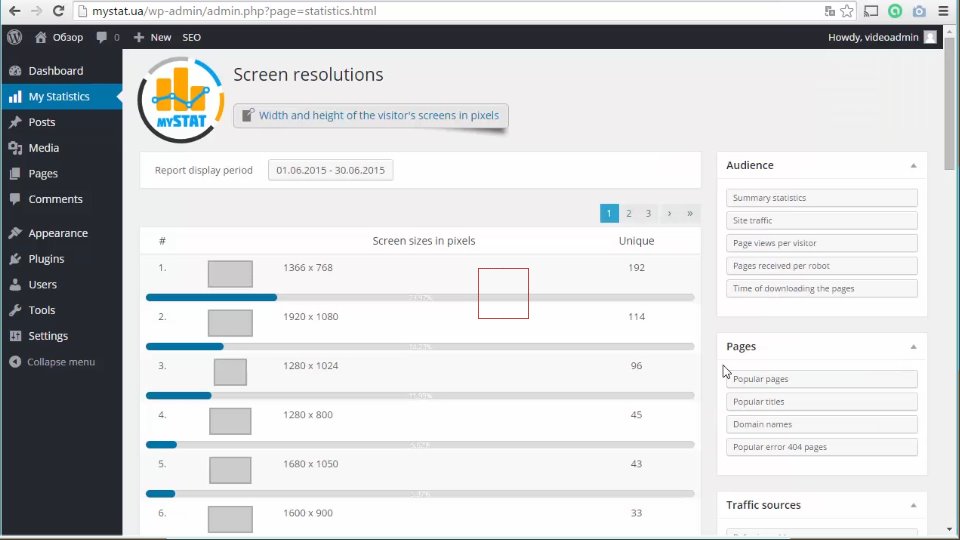
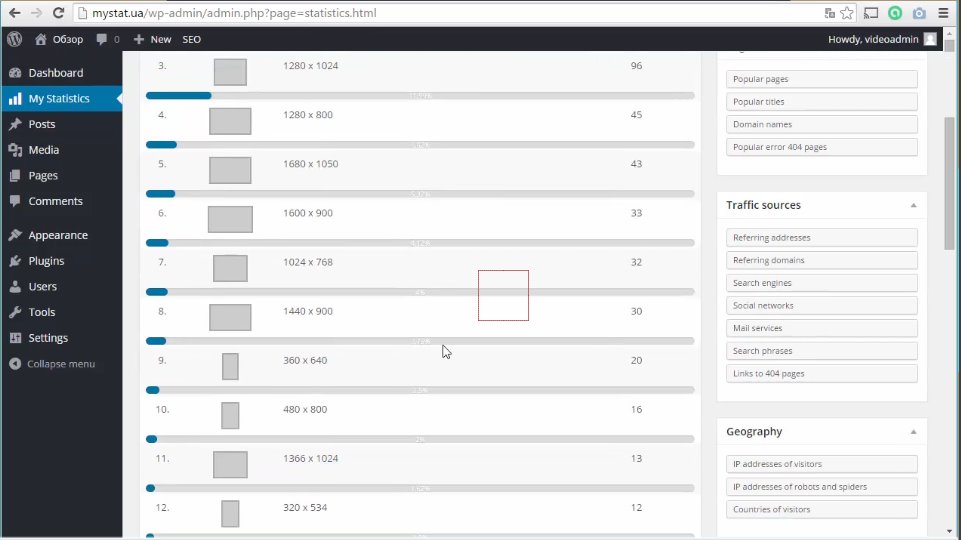
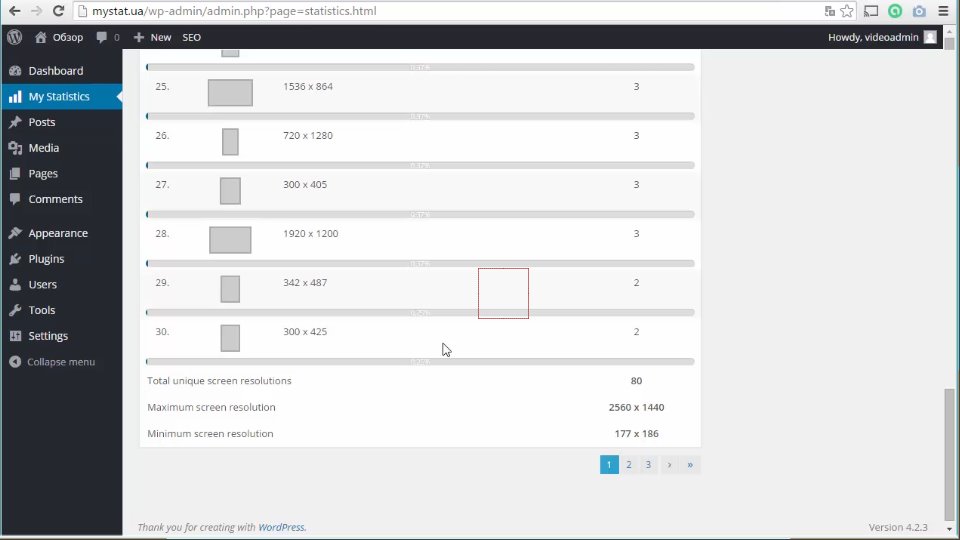
Screen resolution.
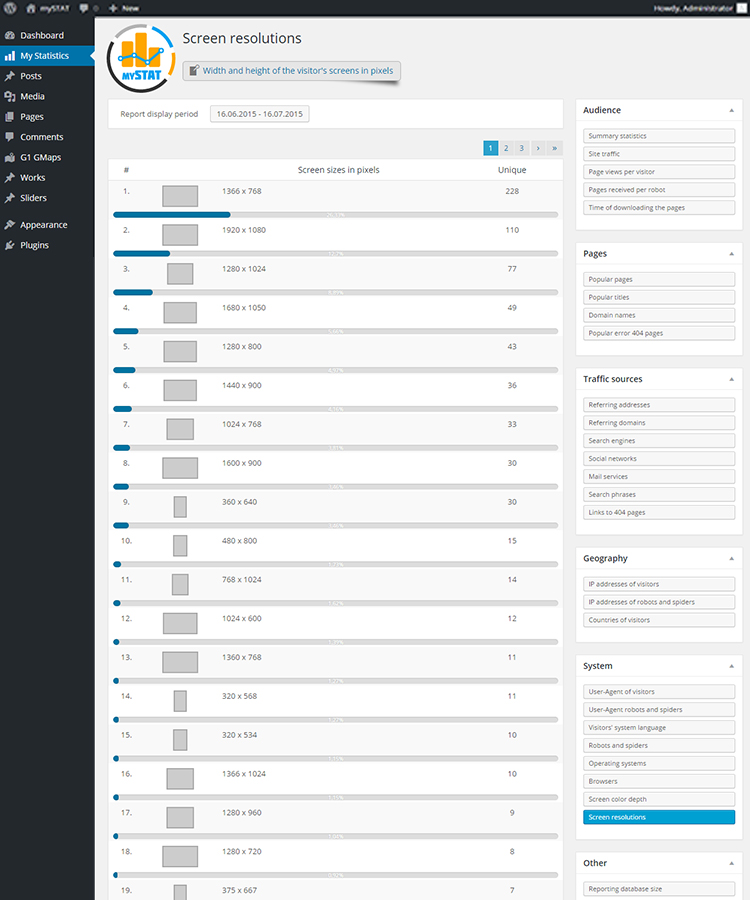
The next section will help designers and programmers, as it deals with the client’s screen resolution. With this information it is possible to correctly identify trends, orientation and color space, and to know for certain what the customer will see and what it all will look like on the client’s side.
Section: Other.
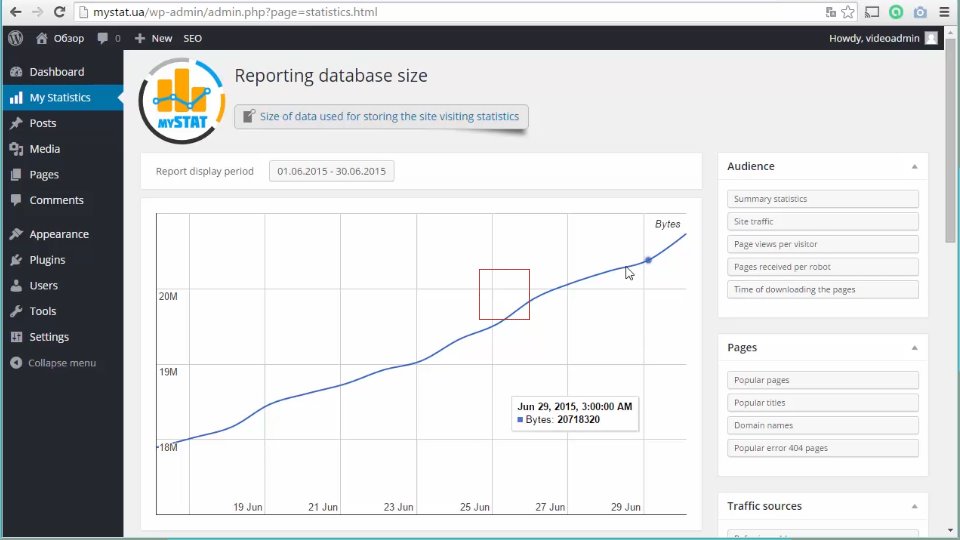
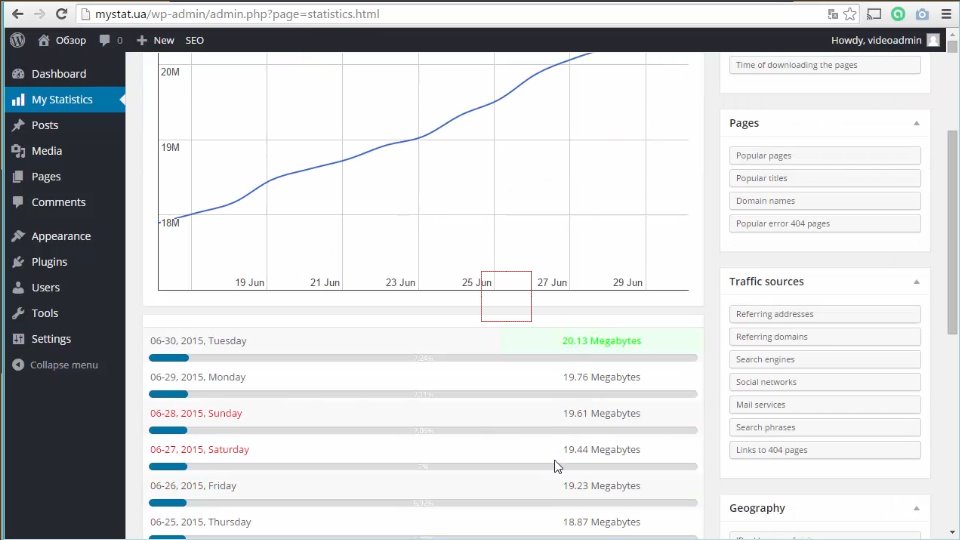
Reporting database size.
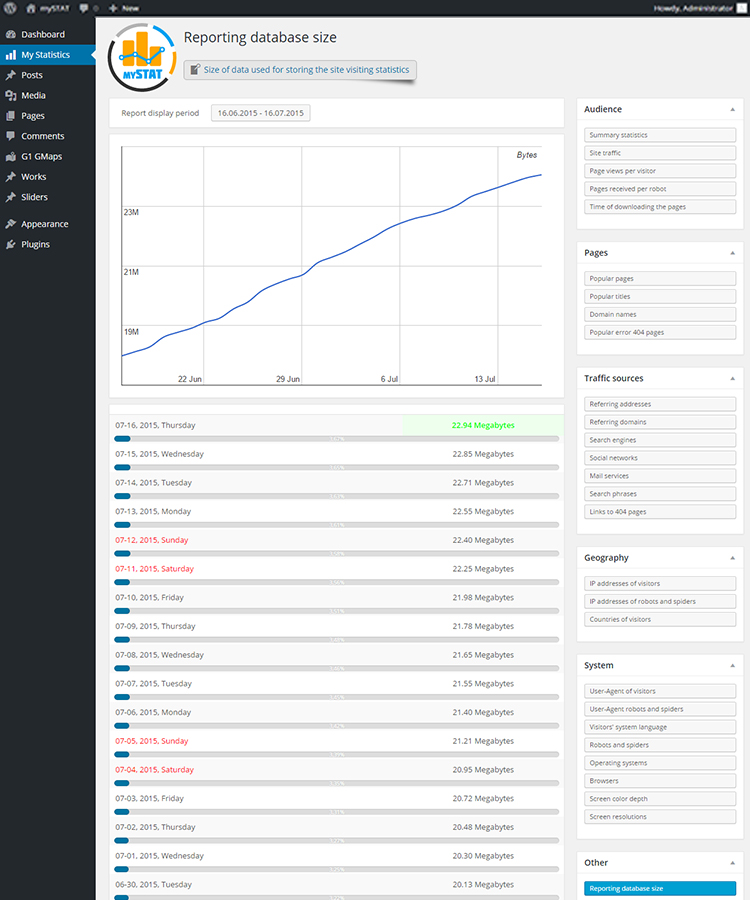
Here you can get the details on database size used by statistics data. Other operations on the database will be available in future.
The bottom line.
At the moment this is all, but I can assure you that shortly MyStat will have additional, equally important functions, there will be new features, the number of which will only grow with each update. In this respect I’d like to remind you that everyone who purchases MyStat now will get all further updates absolutely free of charge, including full technical support! Start your business right, develop and promote your web-site based on reliable information together with myStat! I wish you all good luck and well-being!